
India’s exports to UAE in key sectors show a surge post-CEPA
The historic India-UAE Comprehensive Economic Partnership Agreement (CEPA) made operational in May this year has boosted India’s exports in several sectors and opened a commercial gateway for multiple companies.
Top gainers from the India-UAE CEPA include Electrical machinery & equipment (48%); Gems & Jewellery (22%); Cereals (65%); Inorganic Chemicals (60%) and Automobiles (35%) during this period.
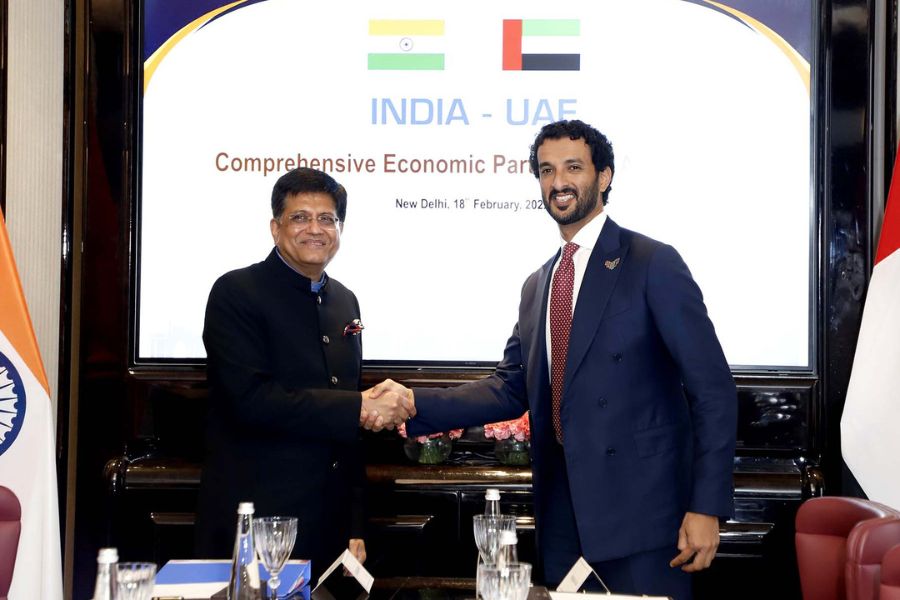
Image Source: pib.gov.in
The growing economic and commercial relations of India-UAE have evolved into a significant partnership over time. With introduction to CEPA, India will now enjoy preferential market access by the UAE on over 97% of its tariff lines accounting for 99% of Indian exports to the UAE in value terms specifically from labor-intensive sectors like Gems and Jewellery, Textiles etc.
Performance report post CEPA
With current growth rate, CEPA is expected to increase the total value of bilateral trade in goods to over US$100 billion and trade in services to over US$ 15 billion within next five years. The launch of CEPA has already started creating a significant impact on India-UAE trade.
After the implementation of CEPA, the trends in India’s export and import have outperformed as compared to last year figures. With marginal growth in India’s global exports, a jump of 12.5% can be seen in India’s exports to the UAE. Similarly India’s non-oil exports to the UAE saw a jump of 8% in June-Oct this year.
Trend in India’s exports to UAE post-CEPA
| Period | June-October 2021* | June-October 2022* | Year-on-Year Change (%) |
| India’s Global Exports | 170.93 | 182.96 | 7% |
| India’s Exports to the UAE | 11.27 | 12.67 | 12.5% |
| India’s Global Non-Oil Exports | 145.17 | 142.07 | -2% |
| India’s Non-Oil Exports to the UAE | 8.97 | 9.69 | 8% |
| India’s Imports from the UAE | 18.3 | 22.2 | 21% |
| India’s Non-oil Imports from the UAE | 9.9 | 10.9 | 9% |
| India’s Non-oil Imports from the UAE (EXCL. Non CEPA related Platinum imports) | 9.9 | 9.7 | -2% |
Source: Ministry of Commerce and Industry; *Figures in US$ million
Top gainers from the India-UAE CEPA include Electrical machinery & equipment (48%); Gems & Jewellery (22%); Cereals (65%); Inorganic Chemicals (60%) and Automobiles (35%) during this period.
Top gainers from the India-UAE CEPA
| Chapter | Description | Jun-Oct 2022* | Jun-Oct 2021* | Absolute change | % change |
| 85 | Electrical machinery and equipment | 1587.92 | 1070.11 | 517.81 | 48% |
| 71 | Gems & Jewellery | 2538.81 | 2082.4 | 456.41 | 22% |
| 10 | Cereals | 308.05 | 186.35 | 121.7 | 65% |
| 28 | Inorganic chemicals | 226.82 | 141.58 | 85.24 | 60% |
| 87 | Automobiles | 278.25 | 206.81 | 71.44 | 35% |
Source: Ministry of Commerce and Industry; figures in US$ million
With the benefits of market access provided under the FTA, some other products exported to UAE have noted an impressive growth this year, these include zinc with 59% of growth recorded this year among other food items, listed below:
Other high growth export products
| Chapter | Description | Jun-Oct 2022* | Jun-Oct 2021* | Absolute Change | % Change |
| 79 | Zinc and articles | 70.59 | 44.27 | 26.32 | 59% |
| 17 | Sugars and sugar confectionery | 164.24 | 105.16 | 59.08 | 56% |
| 9 | Coffee, tea, mate and spices | 162.96 | 107.26 | 55.7 | 52% |
| 33 | Essential oils and resinoids; perfumery, cosmetic or toilet preparations | 118.93 | 78.5 | 40.43 | 52% |
Source: Ministry of Commerce and Industry; *Figures in US$ million
Another key benchmark of growth in exports post the India-UAE trade agreement is the issuance of Certificates of Origin (COOs) to establish evidence of origin of the exported goods. Post-CEPA, the count of COOs issued and their values were dramatically improved month on month in 2022. Number of preferential COOs issued stood at 415 in May 2022, which increased to 5,140 by October 2022. Similarly, value of consignments under preferential COOs was at US$ 133.2 million in May 2022, increasing to US$ 1.3 billion in October 2022.
Issuance of COOs post implementation of India-UAE CEPA
| Month | No. of Preferential COOs issued | Value of consignments under the Preferential COO* |
| May-22 | 415 | 133.2 |
| Jun-22 | 2,316 | 310.3 |
| Jul-22 | 3,479 | 410.0 |
| Aug-22 | 4,110 | 391.1 |
| Sep-22 | 5,286 | 508.9 |
| Oct-22 | 5,140 | 1,277.7 |
Source: Ministry of Commerce and Industry; *Figures in US$ million
The India-UAE Comprehensive Economic Partnership Agreement or CEPA has emerged as the first trade agreement signed by India with a major trading partner over the past decade after Japan in 2011. Finalised in a record 88 days, the deal has set a huge target of raising non-oil trade between India and the UAE to US$ 100 billion in five years from US$ 45 billion in 2021.


Leave a comment