

India’s Overseas Markets
As India progressively integrated with the global economy in the post-liberalisation era, its foreign trade has also expanded at a strong pace. Total trade reached US$ 788 billion in 2019-20 compared to US$ 76.1 billion in 1997-98, witnessing a CAGR of 11.2%. During the same period, exports grew at a CAGR of 10.5% to reach US$ 313.4 billion, while imports grew at a CAGR of 11.7% during the period to reach US$ 474.7 billion.
While India has intensified its trade engagements with a number of countries over the years, the actual trade remains fairly limited to a few markets. To ensure greater diversification, the Government of India introduced Focus Market Scheme, Market Linked Focus Product Scheme and Focus Product Scheme. Greater attention was given to penetration in new markets, particularly Asia and Latin America.
India’s top trade partners (figures in US$ million for 2019-20)
|
Rank |
Country |
Export |
Import |
Total Trade |
Trade Balance |
|
1 |
U S A |
53,088.77 |
35,819.87 |
88,908.65 |
17,268.90 |
|
2 |
CHINA P RP |
16,612.75 |
65,260.75 |
81,873.50 |
-48,647.99 |
|
3 |
U ARAB EMTS |
28,853.59 |
30,256.65 |
59,110.23 |
-1,403.06 |
|
4 |
SAUDI ARAB |
6,236.86 |
26,857.37 |
33,094.24 |
-20,620.51 |
|
5 |
HONG KONG |
10,967.12 |
16,935.32 |
27,902.43 |
-5,968.20 |
|
6 |
IRAQ |
1,878.17 |
23,740.18 |
25,618.34 |
-21,862.01 |
|
7 |
SINGAPORE |
8,922.66 |
14,746.78 |
23,669.44 |
-5,824.11 |
|
8 |
GERMANY |
8,290.90 |
13,691.11 |
21,982.00 |
-5,400.21 |
|
9 |
KOREA RP |
4,845.15 |
15,659.70 |
20,504.85 |
-10,814.55 |
|
10 |
INDONESIA |
4,129.33 |
15,061.87 |
19,191.20 |
-10,932.55 |
Source: Department of Commerce
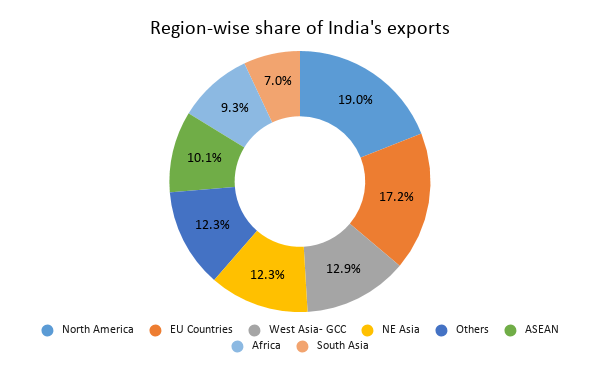
Export share by markets and regions
Despite these sustained efforts, India’s top 10 export markets still account for around 50% of its total exports. However, this is far better than the scenario in 1991-92, when the top 20 countries accounted for over 80% of India’s total exports.
Source: Department of Commerce, figures for 2019-20
The top five destinations for India’s exports in 2019-20 were US, UAE, China, Hong Kong and Singapore, while the top five sources of imports are China, US, UAE, Saudi Arabia and Iraq.
When we look at the regional distribution, the top region-wise markets for India’s exports in 2019-20 were North America (19%), EU (17.1%), and West Asia-GCC (12.9%) North East Asia (12.3%), and ASEAN (10%). The shares of Africa (9.25%) and South Asia (7%) are not too far behind. However, India’s exports are still relatively weak in Latin America (3.21 %), CARs (0.15 %) and CIS (1.19 %).
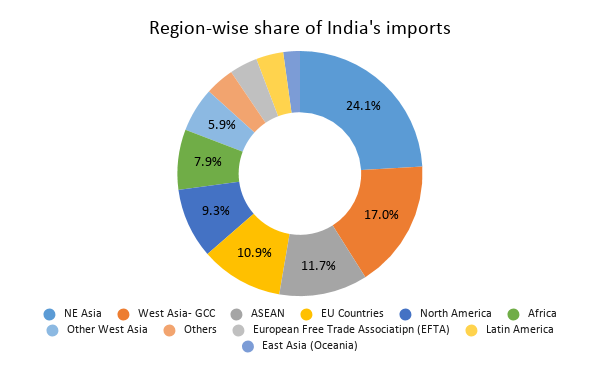
Import share by markets and regions
China was the largest source of imports for India in 2019-20, with total imports reaching US$ 65.2 billion. It was followed by US, UAE, Saudi Arabia, Iraq, Hong Kong, Korea RP and Indonesia. India’s top 10 sources of imports accounted for 54.4% of its total imports in 2019-20. In 1997-98, the ratio was around 58.25%.
Source: Department of Commerce, figures for 2019-20
If we look at the regional distribution of India’s imports, the top regions are Northeast Asia (24.1%), West Asia-GCC (17%), ASEAN (11.7%), EU (10.9%), North America (9.3%) and Africa (7.9%), and Other West Asia (5.9%).