
The India-Chile Trade Puzzle: Unraveling the Potential
Chile ranks as one of the most dynamic economies in Latin America today, with boasts political stability, a robust legal framework, a business-friendly environment, and market access. The existing India-Chile Preferential Trade Agreement (PTA), which was originally signed on March 8, 2006, and came into effect in September 2007, was expanded and put into action by both countries on May 16, 2017. Recent reports also indicate that the two countries are looking to start FTA negotiations.
Despite trade liberalisation, India-Chile trade has not really picked up, given India’s export value of just around US$ 1.2 billion in 2022. Given this scenario, what is the significance of Chile as a trade partner for India in the coming years? TPCI’s research team endeavours to address this question with a deeper analysis into India’s exports to Chile over the past 5 years.
Chile ranks as one of the most dynamic economies in Latin America today, with boasts political stability, a robust legal framework, a business-friendly environment, and market access. It is one of the most open markets for trade, and ranks number 1 among Latin American countries in terms of competitiveness (World Economic Forum, since 1998), Business Environment (EIU, 2019-23), Quality of Governance (World Bank, 2020), and Economic Freedom (Heritage Foundation, 2020).
It is the fifth largest economy in Latin America on nominal GDP as well as GDP at purchasing power parity (PPP) prices. However, it has the highest per-person income (GDP per capita) in Latin America, and is ranked as a high-income country according to the World Bank. Chile is the world’s largest producer of copper, lithium and iodine, apart from agricultural products such as fresh grapes, blueberries, plums and dehydrated apples.
Chile is also a highly liberalised economy as visible from its trade relations with partner countries. It has successfully negotiated 31 trade deals that encompass 65 different economies, collectively constituting 88% of the world’s GDP and enabling access to 4.3 billion consumers. It achieved the distinction of being the first Latin American country to independently secure a Trade Agreement with India. Presently, both nations have an active Partial Scope Agreement, which became effective in August 2017.
Chile’s Trade Agreements
| Trade Agreement | Countries |
|
FTAs
|
|
| Economic Association Agreements
|
|
| Economic Cooperation Agreements |
|
The existing India-Chile Preferential Trade Agreement (PTA), which was originally signed on March 8, 2006, and came into effect in September 2007, was expanded and put into action by both countries on May 16, 2017.
Under this expanded PTA, India has provided tariff concessions on 1,031 product categories to Chile, while Chile has reciprocated by offering concessions on 1,798 product categories to India. These categories were determined based on the HS 2012 nomenclature during the negotiation phase. Since 2021, both nations were in discussions to further expand the PTA with the aim of enhancing its scope. This expansion has the potential to reduce trade restrictions on approximately 90% of tariff lines in India, encompassing around 10,000 different products.
India has extended fixed tariff preferences, ranging from 10% to 50%, on 178 specific tariff lines at the 8-digit level to Chile. In return, Chile has granted India tariff preferences on 296 tariff lines at the 8-digit level, with margins of preference ranging from 10% to 100%.
Earlier this year, Commerce Secretary Sunil Barthwal mentioned that India is looking to sign more FTAs in view of strategic considerations. Being a rich source of critical minerals, particularly Lithium, Chile is one of the potential trade partners under consideration.
Concessions offered by India and Chile under bilateral PTA
| Tariff Concessions by India (178 tariff lines) | Tariff concessions by Chile (296 tariff lines) |
| Meat and fish products (84 tariff lines) | Agriculture products (7 tariff lines) |
| Rock salt (1 tariff line) | Chemicals and pharmaceuticals (53 tariff lines) |
| Iodine (1 tariff line) | Dyes and resins (7 tariff lines) |
| Copper ore and concentrates (1 tariff line) | Plastic, rubber, and miscellaneous chemicals (14 tariff lines) |
| Chemicals (13 tariff lines) | Leather products (12 tariff lines) |
| Leather products (7 tariff lines) | Textiles and clothing (106 tariff lines) |
| Newsprint and paper (6 tariff lines) | Footwear (10 tariff lines) |
| Wood and plywood articles (42 tariff lines) | Some industrial products (82 tariff lines) |
| Some industrial products (12 tariff lines) | Other products (5 tariff lines) |
| Shorn wool & noils of wool (3 tariff lines) | – |
| Other products (7 tariff lines) | – |
Chile’s Trade Scenario
In 2022, Chile imported approximately US$ 109.26 billion worth of goods, with its primary sources being the US, China, Brazil, Argentina, and Germany. The top 10 exporting nations accounted for over 75% of Chile’s total imports. India, with 1.4% share in Chilean imports was ranked 13.
Besides being the leading exporter, the US has also experienced the fastest growth in exports to Chile among the top 10, at a CAGR 18.8% during 2017-22. It is followed by Argentina (17.5%) and Brazil (14.1%). On a YoY basis in 2022, both the US and Brazil have witnessed strong growth rates of 39% and 35% respectively. China, on the other hand, saw a decline in exports by 4%, leading to a drop in rank from #1 in 2021.
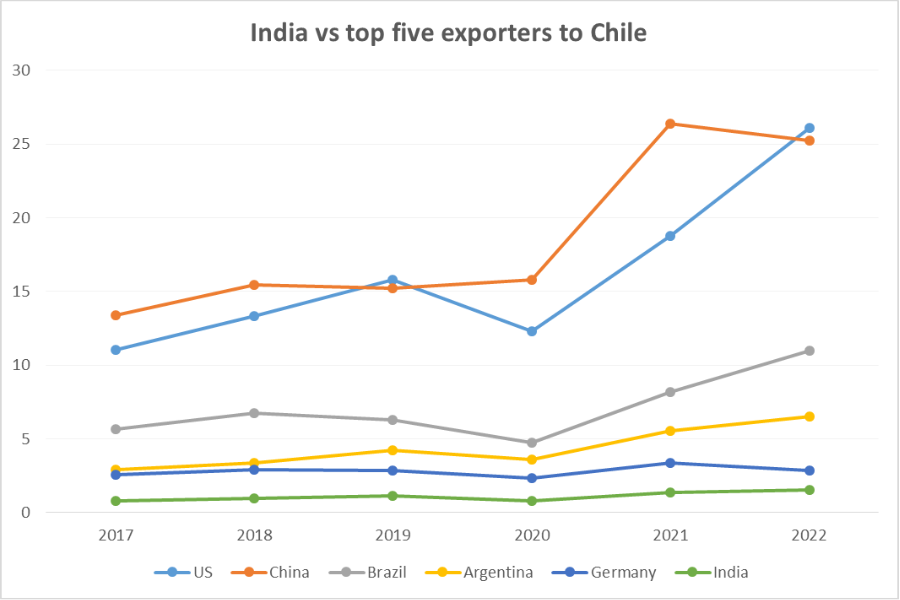
Source: ITC Trade Map, figures in US$ million
The top 3 exporting countries – US, China, Brazil and Argentina alone account for around 63% of Chile’s imports. This factor is important to consider when we are trying to ascertain trade growth potential for India under a possible FTA.
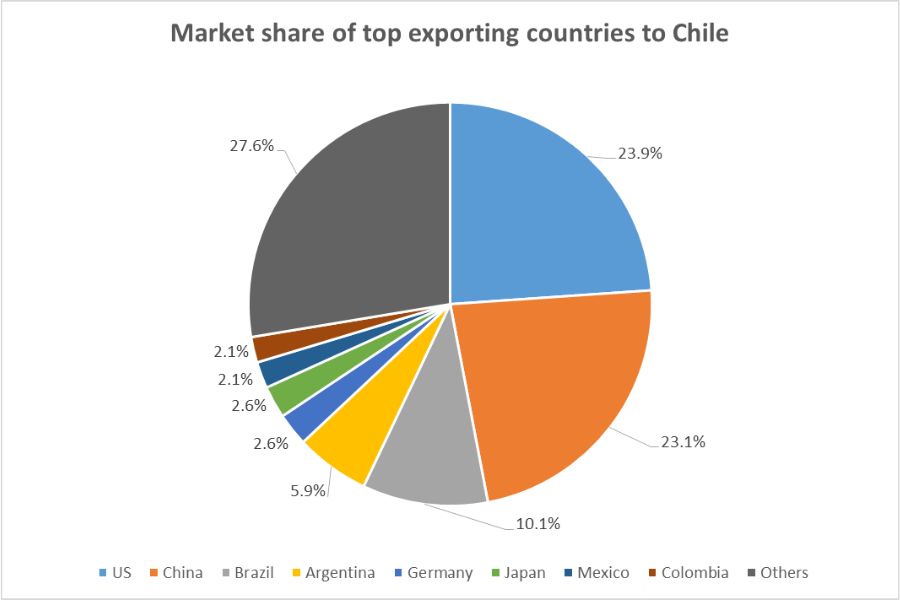
Source: ITC Trade Map; based on Chile’s import data for 2022
Chile’s import dynamics
Chile’s top five imported products in 2022 included mineral fuels, vehicles, heavy machinery, electrical machinery, and plastics and related articles. Its imports witnessed a positive CAGR of 13% from 2017-22.
In order to ascertain India’s top products of export potential to Chile, we have compared India’s top 20 exports with Chile’s top 20 imports at the HS 2-digit level to identify common products, barring HS 27 (Mineral Oil). These 20 product categories account for 77% of Chile’s non-oil imports. Further, we have looked more comprehensively at India’s performance in top 10 products (based on India’s overall exports), that also count among Chile’s top 20 imports (barring HS 27, i.e. Mineral Fuels).
Potential product categories for export potential to Chile by India
| Code | Product label | Imported value (2022) | Chile’s import CAGR (2018-22) | Top exporting countries & share (2022) |
India’s export CAGR (2018-22) |
India’s rank and share |
| ‘87 | Vehicles other than railway or tramway rolling stock… | 12,051.895 | 7.0% | China (28.9%); Brazil (16.6%); US (8.9%) | 14% | #8, 4.3% |
| ’84 | Nuclear reactors, boilers, machinery… | 10,730.591 | 7.0% | China (29.9%); US (20.2%); Germany (5.9%) | 19% | #20, 0.8% |
| ’85 | Electrical machinery and equipment… | 8,636.924 | 11.0% | China (59.6%); Vietnam (7.3%); US (6.1%) | 49% | #10, 1.5% |
| ’39 | Plastics and articles thereof | 3,395.619 | 11.0% | China (30.3%); US (17.7%); Brazil (10.5%) | 16% | #15, 0.9% |
| ’30 | Pharmaceutical products | 2,332.611 | 15.0% | US (16.4%), Germany (12.7%), Belgium (7.8%) | 17% | #4, 6.6% |
| ’72 | Iron and steel | 2,253.684 | 12.0% | China (52.5%); Brazil (15.2%); Japan (7.5%) | 9% | #10, 1.2% |
| ’73 | Articles of iron or steel | 1,918.37 | 10.0% | China (57.3%); US (8.9%); Germany (3.9%) | -23% | #11, 1.5% |
| ’10 | Cereals | 1,882.449 | 24.0% | Argentina (56.7%); Paraguay (16%); Canada (13.1%) | 38% | #18, negligible |
| ’29 | Organic chemicals | 1,561.535 | 10.0% | US (41.3%); China (29.1%); Brazil (4.6%) | 8% | #5, 3.8% |
| ’62 | Articles of apparel and clothing accessories… | 1,366.698 | -1.0% | China (69.9%); Bangladesh (7.7%); Area nes (5.4%) | -14% | #5, 2.1% |
Source: ITC Trade Map, CATR Analysis
On looking at the trade data, we note that India has a single-digit market share in all these products, with pharma at the top (6.6% of Chile’s imports). This is despite the fact that India ranks among the top 5 in pharma, organic chemicals and articles of apparel & clothing accessories, and among the top 10 in vehicles, electric machinery & iron & steel.
Surprisingly, India had negligible share in Cereals (HS 10) in 2022. Chile’s top 3 imports under the category were Maize or corn (US$ 939.3 million); Wheat and meslin (US$ 813.5 million) and Rice (US$ 100.5 million). There was a drastic drop in rice imports from India from US$ 4.8 million in 2021 to US$ 274,000 in 2022. While Chile’s overall rice imports grew by 6% YoY in 2022, there has been a drastic drop in imports from India (-94% YoY), Brazil (-90% YoY), Pakistan (-57% YoY) and Vietnam (-40% YoY). Conversely a sharp increase was witnessed in imports from Paraguay (57% YoY), which has seen a sharp rebound in its overall rice exports from US$ 322 million in 2021 to US$ 293.35 million in 2022.
Electrical Machinery and Equipment is India’s fastest growing category amongst these segments. Here, India is witnessing strong 5-year CAGR among almost all the top categories led by Insulated wire, cable (‘8544, 74%); Electrical generating sets & rotary converters (‘8502, 70%) and Telephone sets incl smartphones (56%). On the other hand, for HS 87 (vehicles), there is strong growth over the past five years in motorcycles (‘8711, CAGR of 43%); tractors (‘8701, CAGR of 40%) and their parts and accessories. The top exported category of Motor cars (‘8703) has seen a steady export CAGR of around 11%. Definitely, India has scope to expand its share in the Chilean market.
Another chapter where India is seeing strong growth is HS 84 (Nuclear reactors & parts), where self-propelled bulldozers (HS ‘8429) and pumps for liquids (HS ‘8413) are leading growth with 5-year CAGRs of 49% and 50% respectively. They are followed by transmission shafts (HS ‘8483) and machinery for sorting, screening, separating, etc (HS 8474), which have showcased 5-year CAGRs of 37% and 29% respectively.
In Chapter 72 (Iron & Steel), India is currently growing at a slower rate in its exports than Chile’s import rate. As is visible, the market is dominated by China currently with a share of 52.5%. India’s exports of this chapter to Chile are seen to be fluctuating over the past few years from a peak of US$ 15.7 million to a low of US$ 4.5 million. However, 2022 saw a strong rebound with exports tripling to US$ 27.7 million as compared to the previous year. While India’s growth in plastics is impressive, the current market share is still low at around 0.9%.
Summary
Indian companies are showing some good momentum in key import sectors of Chile, their current low share indicates good headroom for growth (as analysed in this blog). While the trade value between India and Chile is not particularly high, the constituents of trade showcase the importance of a market like Chile to Indian companies. There is a strong momentum we can see in critical technology sectors like HS 84, 85 and 87. India also has a strong presence in iron & steel, pharma and plastics. On the other hand, in F&B, which is a traditional sector of strength for India the scenario is quite surprisingly different.
In our focus group of fresh and processed food products (HS 02-22 excluding HS ’05 and ’06), a share of just 0.23%! This has potential to be increased quite significantly. IBT had a conversation some time back with HE Juan Rolando Angulo Monsalve, Ambassador of Chile to India, who asserted, “In the field of agriculture, Chile is a world leader in exports in the southern hemisphere and we have a lot of complementarities with India. Our products arrive here off season so we are not in competition with each other. This is also good for customers in both countries.” He also added during the interaction, “We want to deepen our economic relationship by taking advantage of India’s competitiveness in sectors like information technology services, health, biotechnology and are working on that on a continuous basis.”
As per latest information by the embassy of India in Chile, Indian investments in Chilean companies are presently at around US$ 220 million. As India seeks to improve its share in high technology oriented exports and move up the value chain, markets like Chile, with strong economic potential and friendly investment environment need to be tapped with strong intent and long-term focus – as a destination for growth in both trade and investment. Indeed, investment and services are identified as key focus areas of liberalisation in trade negotiations between India and Chile. This can definitely provide a strong growth trajectory to India’s business relations with Chile and the larger Latin American region.


Leave a comment