
Indian cereals exports need to prepare for a quantum leap
Globally, India ranks 5th in total export of cereals. However, looking at the top exported products, India’s share is negligible in all categories barring rice. This article emphasises the need for ensuring a larger presence for India in the global market through product diversification and value addition.
- The Indian economy stands out in the global market, being the 5th largest exporter of cereals. Share of cereals in the food basket of India’s exports stood at 24% during 2020-21.
- Recent trends have shown the cereals from India are reaching new destinations. For rice, India exported to destinations such as Timor-Leste, Puerto Rico, Brazil, Papua New Guinea, and Zimbabwe.
- Rice and wheat account for 36% of the cereals production in the country, with maize and nutri-cereals having next big share in the total production.
- Global demand for wheat is expected to increase during 2020-2029, with demand to be led by China, EU, the US, India and Russia. Demand for maize is expected to increase during 2020-2029 with 60%.
Image: Shutterstock
Cereals hold a great importance for the Indian economy, given that India is the largest producer of crops like rice, wheat and other cereals. In 2019, cereals accounted for Rs. 3.6 trillion or 27% of the Gross Value Added (GVA) contributed by crops.
In addition, the economy also stands out in the global market, being the 5th largest exporter of cereals. Share of cereals in India’s food basket of exports stood at 24% during the last year. In 2020-21, India exported US$ 10.1 billion worth of cereals. Looking at the trend, during the past five years i.e., 2016-2020, exports of cereals from India have seen a significant growth, increasing at a CAGR of 11.8%.
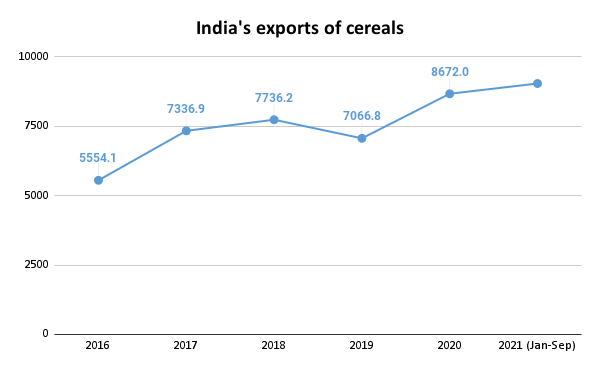
Source: ITC Trade Map
Reaching new destinations
Recent trends have shown that the cereals from India are reaching new destinations. For rice, India exported to destinations such as Timor-Leste, Puerto Rico, Brazil, Papua New Guinea, and Zimbabwe. Before FY 2020-21, exports to these countries were negligible. Similarly, as table 2 has shown below, exports of wheat and other cereals also experienced a similar trend. While wheat found space in new markets such as Yemen, Indonesia and Bhutan, other cereals witnessed higher exports in markets such as Sudan, Poland and Bolivia.
A study has attributed this rise in exports to tighter supplies from the competitors such as Vietnam & Thailand, procurement at attractive Minimum Support Prices (MSP), ample domestic output and strong global demand.
|
India’s exports of cereals to new destinations |
||||||||
|
Rice |
Wheat |
Other cereals |
||||||
| Countries | 2019-20 | 2020-21 | Countries | 2019-20 | 2020-21 | Countries | 2019-20 | 2020-21 |
| Timor-Leste | 0.0 | 18.0 | Yemen Republic | 0.0 | 24.1 | Sudan | 0.05 | 0.31 |
| Puerto Rico | 0.0 | 12.0 | Indonesia | 0.0 | 15.3 | Poland | 0.02 | 0.13 |
| Brazil | 0.0 | 11.2 | Bhutan | 0.0 | 0.8 | Bolivia | 0.01 | 0.11 |
| Papua N Guinea | 0.0 | 7.8 | Philippines | 0.0 | 0.6 | Colombia | 0.03 | 0.04 |
| Zimbabwe | 0.1 | 1.5 | Iran | 0.0 | 0.3 | Congo D. Rep. | 0.00 | 0.03 |
Source: Ministry of Commerce and Industry; figures in US$ million
Looking at the composition, the chart below shows that in the export basket, rice comprises the highest share. Maize and wheat comprise 7% in total and rest is contributed by other cereals including rye, barley, oats, grain sorghum etc. This composition comes as no surprise, since India is the second largest producer of rice and wheat. These crops account for 36% of the cereals production in the country, with maize and nutri-cereals having the next highest share in the total production.
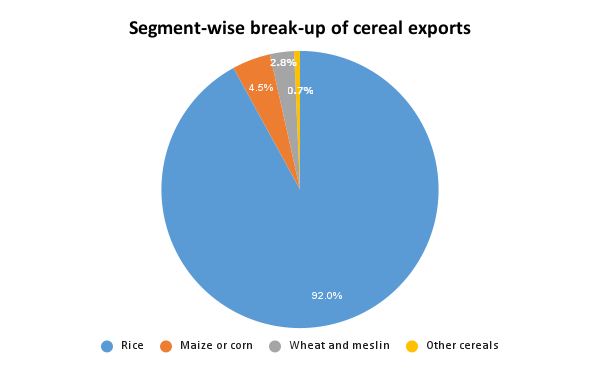
Source: Ministry of Commerce and Industry
India’s presence in top exported cereals globally
Despite good progress in the trade of cereals, India’s share in the global market of cereals is not significant. The table below shows the top 5 exported cereals worldwide. Except for rice, India’s share in the global market for these cereals is generally less than 1%.
|
India’s share in world’s top exported cereals |
|||
| Product | Global trade (US$ billion) in 2020 | India’s exports (US$ billion) in 2020 | Share (%) |
| Maize (excluding seed for sowing) | 35.1 | 0.4 | 1.0 |
| Wheat and meslin | 33.9 | 0.2 | 0.7 |
| Semi-milled or wholly milled rice | 20.1 | 7.5 | 37.3 |
| Durum wheat (excluding seed for sowing) | 11.6 | 0.0 | 0.1 |
| Barley (excluding seed for sowing) | 6.9 | 0.0 | 0.1 |
Source: ITC Trade Map
Exports of value added cereal products also show that India’s share is next to negligible, not more than 2% for top exported processed cereal products.
|
India’s share in world’s top value exported cereals |
||
| Product label | Exported value in 2020 (US$ million) | Share in world’s exports (%) |
| Sweet biscuits | 168.2 | 2.0 |
| Bread, pastry, cakes, biscuits and other bakers’ wares | 139.4 | 0.6 |
| Malt extract; food preparations | 69.7 | 0.8 |
| Food preparations for infant use, put up for retail sale, of flour, groats, meal, starch | 43.2 | 0.4 |
| Prepared foods obtained by swelling or roasting cereals or cereal products | 38.9 | 0.8 |
| Pasta, cooked or otherwise prepared | 22.2 | 0.5 |
| Rusks, toasted bread and similar toasted products | 21.9 | 2.4 |
| Waffles and wafers | 17.2 | 0.4 |
| Uncooked pasta, not stuffed/otherwise prepared | 11.0 | 0.2 |
| Cereals (excluding maize [corn]) | 10.7 | 0.9 |
Source: ITC Trade Map
Counterintuitive to low export share is India’s large surplus of crops. Data on procurement by Food Corporation of India (FCI) shows that India has a stock of food grains that’s 2.7 times more than the requirement. The rise in stock is partly attributed to high Minimum Support Prices (MSP). MSP for paddy increased by 43% during 2013-14 to 2020-21, while for wheat, it increased by 41% during 2013-14 to 2020-21. Reserve Bank of India, in its annual report, highlighted, “India has now reached a stage in which surplus management has become a major challenge… Going forward, shifting the terms of trade in favour of agriculture is key to sustaining this dynamic change and generating positive supply responses in agricultural production.” The central bank has emphasised on aligning infrastructure and new opportunities in agriculture with the trade policies.
The central bank states that an enabling legislative framework, which includes Essential Commodities Act (ECA) 2020, Farmers’ Produce Trade and Commerce Ordinance 2020 and Farmers Agreement on Price Assurance and Farm Services Ordinance 2020 can be complemented with crop diversification and food processing to improve export share in the world market.
Production data of 2019-20 shows that rice production in India stood at 118.4 million tonnes (20%), followed by wheat (107.6 million tonnes), nutri/coarse cereals (47.5 million tonnes), maize (28.6 million tonnes), nutri-cereals (17.2 million tonnes), bajra (10.3 million tonnes) while other cereals had production less than (10 million tonnes).
Demand for cereals globally also is projected to be bright in the near future. Global demand for wheat is expected to increase during 2020-2029, led by China, EU, the US, India and Russia. Demand for maize is expected to increase during 2020-2029, with 60% of the increase attributed to feed use. Maize for human consumption is expected to be driven by population growth and increasing global per capita incomes, increasing by 23 Mt during 2020-2029. Top markets for maize would continue to be Mexico, EU, Japan, Egypt and Vietnam.
Demand for other cereals such as barley, oats, rye, sorghum and millets is expected to increase by 30 MT during 2020-2029 with feed demand accounting for 46.7% of this increase, followed by food (33%) and industrial use (20%). Low supply from India emphasises the need for focused efforts to boost exports. NITI Aayog has recommended to export 25% of food production. It suggested that to prevent stockpiles, it is necessary to diversify the production towards nutri-cereals and boost exports with focus on food processing.


Leave a comment