
India’s growing ceramic footprint
India is the 5th largest exporter of ceramic products, and its exports of ceramic products have grown at a CAGR of 16% over the past five years. This edition of IBT Data Point analyzes the current size, growth and potential for India’s ceramic exports in the world’s leading markets.

Image credit: Shutterstock
India exported ceramics products worth US$ 2.31 billion in 2021. Exports have grown at a CAGR of 16% between 2017 and 2021. India’s top export markets for ceramics are the US (8.1% share); Saudi Arabia (7.6% share) & the UAE (5.6% share). Markets witnessing strongest CAGR during 2017-21 are Libya (141%); Indonesia (88%); Russia (67%), Jordan (52%) & Thailand (48%).
Notably, India has witnessed a positive CAGR across its top 25 export markets of ceramics products between 2017 and 2021. It also has a positive trade balance with all its top 25 export markets, except for Germany.
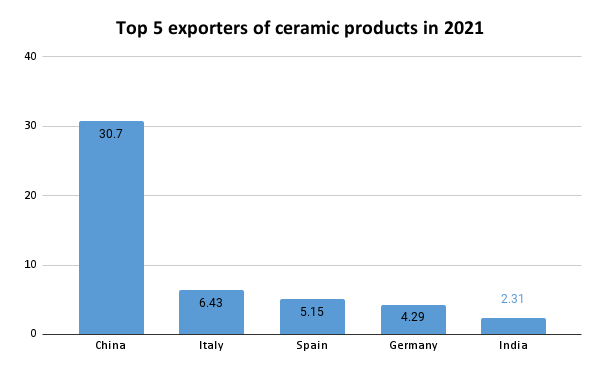
Source: Trade Map; Figures in US$ billion
Source: Trade Map; Figures in US$ billion
INDIA’S CERAMIC EXPORTS
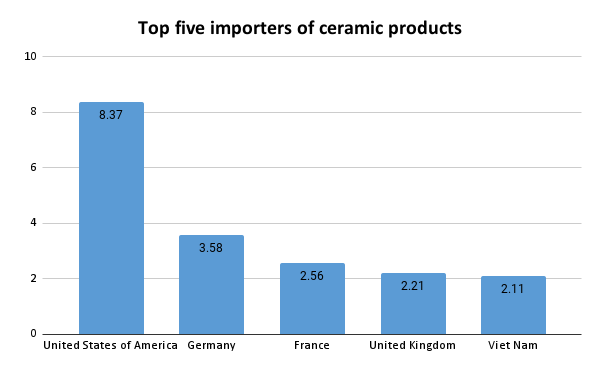
Market wise share of India’s ceramics exports is quite diversified, with the top 10 importing countries accounting for only 13% of its exports. Saudi Arabia, UAE, Iraq and Nepal account for Positions 2-5 among India’s top exporting markets, but are nowhere among the global top 10 importers. Only two of the top 10 markets globally – US & UK – figure in India’s top 10 export markets.
The leading markets where India has been unable to mark a significant presence are: Germany, France, Viet Nam, China, Republic of Korea, Netherlands, Japan and lastly Canada. Vietnam is the fastest growing import market for ceramics among the top 10 between 2017-21, growing at a CAGR of 113.2%.
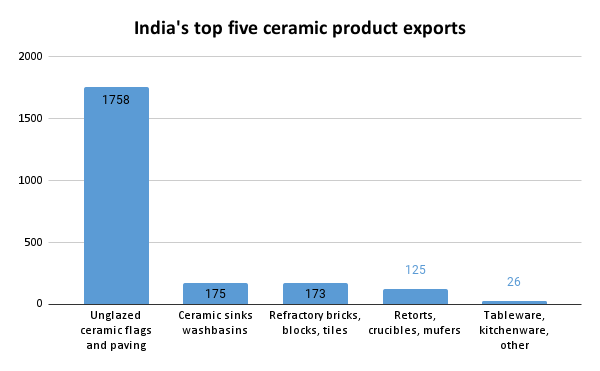
Source: Trade Map; Figures in US$ million; data at HS 4-digit level
| HS code | Product label | India’s Top exports to Viet Nam (in US$ mn) | Viet Nam’s top imports from the World (in US$ mn) |
| ‘6907 | Unglazed ceramic flags … | 13.828 | 633.579 |
| ‘6903 | Retorts, crucibles, mufflers … | 3.641 | 45.651 |
| ‘6902 | Refractory bricks, blocks … | 0.535 | 108.234 |
| ‘6910 | Ceramic sinks, washbasins … | 0.137 | 697.427 |
| ‘6911 | Tableware, kitchenware … | 0.052 | 340.117 |
| ‘6914 | Ceramic articles, n.e.s. … | 0.014 | 79.081 |
| ‘6912 | Tableware, kitchenware … | 0.001 | 21.96 |
| ‘6909 | Ceramic wares for laboratory, … | 0.001 | 78.83 |
| ‘6901 | Bricks, blocks, tiles … | 0 | 1.127 |
FOCUS MARKET: VIETNAM
We have selected Vietnam for a deeper analysis into product groups. Import CAGR (2017-2021) of Viet Nam has been recorded at 113.2%. Vietnam’s imports of ceramic products mainly come from China. India’s exports account for very little share in Vietnam’s market. Therefore, India has a great opportunity to export to Vietnam as it’s the third largest exporter to the country following China and Japan.
While Vietnam’s imports from the world have grown by 113.2% over 2017-21, India’s growth in exports during the period to Viet Nam is just at 9.96%. Vietnam’s top imported products globally are from HS Codes ‘6910, ‘6907 and ‘6911. India’s exports to Vietnam in these categories are very low at US$ 0.14 million, US$13.83 million and US$ 0.05 million respectively. Out of these, HS Codes 6910 and 6907 have been strong for India, as they account for its top 2 global ceramics exports at the 4-digit level. So, these two product segments can be further explored for expansion by India in exports to Vietnam.


Very insightful article.