
A chronicle of India’s export journey during FTP 2015-20
India’s share in global exports has grown marginally from 1.6% to 1.7% during 2015-19, with both exports and imports growing at a CAGR of 5.2%. The upcoming FTP needs to focus on growing India’s share in high-tech products and fuel investment-led export growth, while addressing the decline in competitiveness of labour intensive sectors
- India’s share in global merchandise exports has stayed relatively stable between 2015-2019 (duration of the previous Foreign Trade Policy for which data is available), growing from 1.6% to 1.7%.
- Exports and imports have grown at a CAGR of 5.2%. Imports increased by US$ 88 billion and exports increased by US$ 59.4 billion. India’s overall share in global exports has increased from 1.61% in 2015 to 1.73% in 2019. In imports, the share has increased from 2.36% to 2.51%.
- Exports to the Netherlands and Nepal have increased significantly over the years. The Netherlands jumped from being the 14th largest importer in 2015 to being the 6th largest importer in 2019. Similarly, Nepal became the 10th largest importer in 2019 from being 23rd largest in 2015.
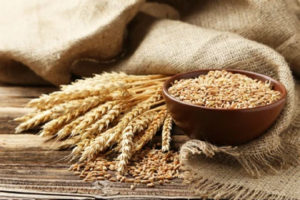
- F&B constitutes only an 11.41% share in India’s export basket. The growth witnessed too, has been unsatisfactory (CAGR of 2.8%). It is hence important that the F&B and food processing are emphasized in the upcoming foreign trade policy.
- Exports of commodities constituting more than 2% share in India’s export basket in 2015 have increased in 2019 too with an exception in the form of diamonds and rice. The diamond’s plunge was transient. But, rice exports require attention, apart from textile, cotton, and bovine meat exports.
The foreign trade policy for 2015-20 is all set for renewal on March 31st, 2021. This FTP is much awaited as it will act as a framework for trade for the period when the world would be coming out of the Covid-19 trauma. And the exporters will be facing challenges different from those until now. Discussions are going on and suggestions have been invited. In this infographic, we analyse how India’s exports trended in the 2015-19 period under the previous FTP, as per the latest data available. While export data for India is available from January-November 2020, the same is not considered as it is an outlier due to the ongoing pandemic.
1. Trends in trade
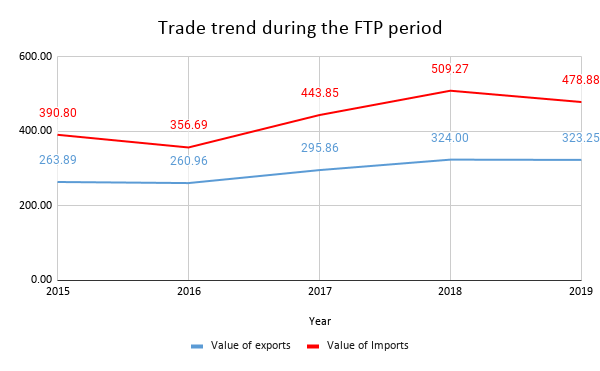
Source: UN Comtrade, Figures in US$ billion
India’s merchandise imports have increased from US$ 390.8 billion in 2015 to US$ 478.88 billion in 2019, while merchandise exports have improved from from US$ 263.89 billion to 323.25 billion during the period. Growing at a CAGR of 5.2%, exports and imports have largely seen an upward trend. A slight slide seen in both post-2015 was due to the global slowdown, which reduced exports and slumps in crude oil prices which reduced the import bill.
Imports have exceeded exports and have largely been rising after 2016. During the entire period, the greatest increase in exports, as well as imports, was seen in 2018, mainly attributed to the trade war between the US and China that benefitted Indian exports. On the other hand, the import bill surged owing to the crude oil prices at US$ 65.23 per barrel – the highest over the entire period. India’s overall share in global exports has also increased from 1.61% in 2015 to 1.73% in 2019. In terms of imports, the share has increased from 2.36% to 2.51%.
2. Where have exports been headed?
Over the last five years, countries that have acquired a greater share in India’s exports are the US, China, Singapore, Bangladesh, Belgium, Malaysia, Netherlands, Italy, South Korea, and Nepal. Countries whose share has fallen are UAE, Hong Kong, UK, Germany, Saudi Arabia, Vietnam, France, and Japan.
Growth trends in India’s top export markets
| Importers | Exported value in 2015 | Share in India’s exports | Exported value in 2019 | Share in India’s exports |
| United States of America | 40,339.24 | 15.29 | 54,288.19 | 16.79 |
| United Arab Emirates | 30,240.23 | 11.46 | 29,539.36 | 9.14 |
| Hong Kong, China | 12,144.57 | 4.60 | 11,478.4 | 3.55 |
| China | 9,539.52 | 3.61 | 17,278.83 | 5.35 |
| United Kingdom | 8,889.81 | 3.37 | 8,797.2 | 2.72 |
| Singapore | 7,801.58 | 2.96 | 10,738.69 | 3.32 |
| Germany | 7,022.96 | 2.66 | 8,569.83 | 2.65 |
| Saudi Arabia | 6,969.59 | 2.64 | 5,974.04 | 1.85 |
| Bangladesh | 5,473.42 | 2.07 | 8,242.92 | 2.55 |
| Viet Nam | 5,330.98 | 2.02 | 5,512.87 | 1.71 |
| Belgium | 5,003.05 | 1.90 | 6,184.55 | 1.91 |
| Malaysia | 4,889.37 | 1.85 | 6,268.54 | 1.94 |
| Netherlands | 4,873.38 | 1.85 | 8,906.98 | 2.76 |
| France | 4,818.60 | 1.83 | 5,434.29 | 1.68 |
| Japan | 4,453.75 | 1.69 | 4,815.59 | 1.49 |
| Italy | 4,227.35 | 1.60 | 5,190.23 | 1.61 |
| Korea, Republic of | 3,603.30 | 1.37 | 4,653.98 | 1.44 |
| Nepal | 3,163.26 | 1.20 | 7,108.86 | 2.20 |
Source: UN Comtrade, Figures in US$ million
The countries where India’s exports have significantly increased are the Netherlands and Nepal. The Netherlands jumped from being the 14th largest importer in 2015 to being the 6th largest importer in 2019. Similarly, Nepal became the 10th largest importer in 2019 from being 23rd largest in 2015. The greatest CAGR was achieved for Nepal (22.4%) and Netherlands (16.3%) followed by China (16%), Bangladesh (10.8%), Singapore (8.3%), and the US (7.7%).
In comparison to the global CAGR over this period (5%), the annual growth rate of India’s exports has been slightly higher at 6%. Further, in comparison to the other Asian countries, India is behind Vietnam, Cambodia (14% each), and Bangladesh (7%). While Bangladesh and Cambodia have grown from a small base, Vietnam has emerged as a global benchmark. Cheap, educated, skilled labour, coupled with a favorable investment environment, have helped make this US$ 1 trillion economy a success story in exports.
3. Top exported categories
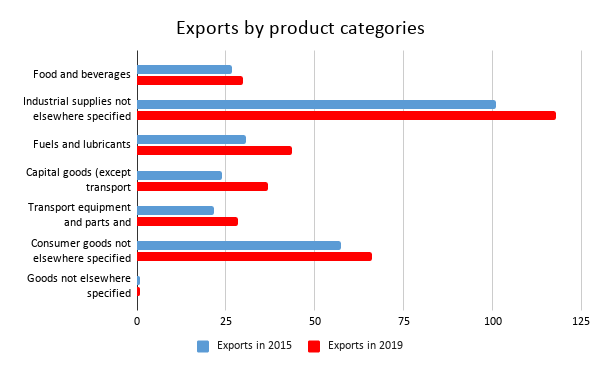
Source: WITS, Figures in US$ billion
All the broad product categories have witnessed a surge in exports from 2015 to 2019. However, the highest CAGR has been seen in capital goods (11.3%), fuels and lubricants (9.26%), and transport equipment (7.1%). These categorioes also saw a growth in their share of total exports from 2015-19.
Industrial supplies, which is the largest segment constituting a 38.6% share in India’s total exports in 2015 have grown at a slower pace with a CAGR of 3.9%. Consumer goods, the second largest segment with a 21.9% share in exports has also grown at a CAGR of only 3.56% to reach a 25.2% share in 2019.
Despite being an agrarian economy, food and beverages constitute only an 11.41% share in India’s export basket. The growth witnessed too, has been unsatisfactory (CAGR of 2.8%). It is hence important that the F&B and food processing segments are emphasized in the upcoming foreign trade policy. This will assure the growth and prosperity of industry as well as farmers.
4. Major products exported
Export share of commodities with value greater than US$ 2 billion in 2015 has increased in 2019 as well, with the exceptions of diamonds and rice. Diamonds have declined (by as much as 15%) only in 2019, after seeing a continuous rise after 2015. Rice, too which is a major component of exports, has seen its share fall from 2.41% to 2.1% during the period.
Export share of top commodities from India*
| Code | Product label | Share in value in 2015 | Share in value in 2019 |
| 2710 | Petroleum oils and oils obtained from bituminous minerals (excluding crude); preparations containing | 11.35 | 13.17 |
| 7102 | Diamonds, whether or not worked, but not mounted or set (excluding unmounted stones for pick-up | 8.28 | 6.76 |
| 3004 | Medicaments consisting of mixed or unmixed products for therapeutic or prophylactic uses, put | 4.25 | 4.59 |
| 7113 | Articles of jewelry and parts thereof, of precious metal or of metal clad with precious metal | 3.78 | 4.19 |
| 1006 | Rice | 2.41 | 2.10 |
| 8703 | Motor cars and other motor vehicles principally designed for the transport of persons, incl. | 2.04 | 2.16 |
| 0202 | Meat of bovine animals, frozen | 1.53 | 0.95 |
| 8708 | Parts and accessories for tractors, motor vehicles for the transport of ten or more persons | 1.47 | 1.55 |
| 5205 | Cotton yarn other than sewing thread, containing >= 85% cotton by weight (excluding that put | 1.42 | 0.88 |
| 0306 | Crustaceans, whether in shell or not, live, fresh, chilled, frozen, dried, salted or in brine | 1.21 | 1.45 |
| 6109 | T-shirts, singlets and other vests, knitted or crocheted | 1.08 | 0.81 |
| 8905 | Light-vessels, fire-floats, dredgers, floating cranes, and other vessels the navigability of | 1.05 | 1.28 |
| 6204 | Women’s or girls’ suits, ensembles, jackets, blazers, dresses, skirts, divided skirts, trousers | 1.08 | 0.81 |
| 7403 | Copper, refined, and copper alloys, unwrought (excluding copper alloys of heading 7405) | 0.73 | 0.09 |
| 3808 | Insecticides, rodenticides, fungicides, herbicides, anti-sprouting products, and plant-growth | 0.73 | 1.07 |
| 6403 | Footwear with outer soles of rubber, plastics, leather or composition leather and uppers of | 0.73 | 0.58 |
| 3204 | Synthetic organic coloring matter, whether or not chemically defined; preparations based on | 0.71 | 0.84 |
| 5201 | Cotton, neither carded nor combed | 0.71 | 0.33 |
Source: UN Comtrade; *Commodities with export value > US$ 2 billion in 2015 at the 4-digit level
The plunge in the diamond sector was a transient one. Protests in Hong Kong in 2019 reduced exports to the market where 40% of India’s diamonds go. However, rice exports command attention. The increased domestic price due to higher MSP, coupled with high pesticide residue laws in the EU and reduced exports of basmati to Iran contributed to a reduction in India’s rice exports YoY by 7.6%.
This was the second-largest slump experienced by rice after 2016. Iran constitutes ¼ of India’s basmati rice exports. The end of oil imports from Iran, made India lose a significant portion of its Iranian market to Pakistan. EU constitutes 8% of India’s exports of rice, but strict MRL laws imposed by the EU have affected exports in this market as well. The issue needs urgent attention, since these limits are getting more complex and also being adopted by developing countries.
Further, attention should also be paid to exports of bovine meat and cotton yarn and textile products which were India’s expertise, but their share in exports has declined in 2019. The share was 1.5% in 2015 which fell to 0.9% in 2019 in the case of meat and it was 1.4% in the case of cotton yarn which reduced to 0.89% in 2019.
5. What worked and what didn’t?
Among the products whose export value exceeded US$ 2 billion in India’s trade basket, we have tracked the best and worst performing export products at the 2-digit level as below. Aluminium (18.2%), electrical machinery (17.14%), chemicals and machinery (12.6%) rank among the top performing products, while apparel, pearls, cotton and meat are among the worst performers.
Best and worst performing export products
| Best Performers | Worst Performers | ||||
| Code | Product label | CAGR (%) | Code | Product label | CAGR (%) |
| 76 | Aluminium and articles thereof | 18.20 | 61 | Articles of apparel and clothing accessories, knitted or crocheted | 0.32 |
| 85 | Electrical machinery and equipment and parts thereof; sound recorders and reproducers, television | 17.14 | 71 | Natural or cultured pearls, precious or semi-precious stones, precious metals, metals clad | -1.33 |
| 38 | Miscellaneous chemical products | 14.09 | 62 | Articles of apparel and clothing accessories, not knitted or crocheted | -2.75 |
| 29 | Organic chemicals | 12.88 | 52 | Cotton | -5.31 |
| 84 | Machinery, mechanical appliances, nuclear reactors, boilers; parts thereof | 12.60 | 02 | Meat and edible meat offal | -5.58 |
Data source: UN Comtrade, CATR calculation
6. The real winners in terms of export competitiveness
Export competitiveness measured by Revealed Comparative Advantage Index in the year when FTP was brought in, i.e. 2015, and at the end of FTP i.e. 2019 can reveal several things. One of them is a structural change in the export basket. CATR’s calculations reveal the products that have undergone a significant structural change in competitiveness over the period of FTP implementation. India’s competitiveness has significantly increased in these products as indicated by their RCA >1 in 2019 coupled with RCA <1 in 2015. RCA is a tool to measure a country’s export competitiveness in a specific product. It is calculated as a ratio of a product’s share in a country’s exports to its share in global exports.
The product categories that have experienced an increase in competitiveness are machinery, mechanical appliances, nuclear reactors, iron ores, engineering thermoplastic, mineral fuels, and oils and paper products.
Top product categories where India’s export competitiveness has improved
| HS Code | Product label | RCA in 2015 | RCA in 2019 |
| 8411 | Turbojets, turbo propellers, and other gas turbines | 0.13 | 1.43 |
| 2601 | Iron ores and concentrates, incl. roasted iron pyrites | 0.19 | 1.13 |
| 8504 | Electrical transformers, static converters, e.g. rectifiers, and inductors; parts thereof | 0.79 | 1.10 |
| 8483 | Transmission shafts, incl. camshafts and crankshafts, and cranks; bearing housings and plain | 0.84 | 1.20 |
| 3907 | Polyacetals, other polyethers and epoxide resins, in primary forms; polycarbonates, alkyd resins | 0.93 | 1.21 |
| 8408 | Compression-ignition internal combustion piston engine “diesel or semi-diesel engine” | 0.50 | 1.15 |
| 2707 | Oils and other products of the distillation of high temperature coal tar; similar products | 0.56 | 1.42 |
| 8538 | Parts suitable for use solely or principally with the apparatus of heading 8535, 8536 or 8537 | 0.91 | 1.07 |
| 2716 | Electrical energy | 0.05 | 1.07 |
| 8482 | Ball or roller bearings (excluding steel balls of heading 7326); parts thereof | 0.87 | 1.02 |
| 4802 | Uncoated paper and paperboard, of a kind used for writing, printing or other graphic purposes | 0.98 | 1.19 |
Source: Data UN Comtrade, CATR Calculations
7. Lessons for the road ahead
India has done well in terms of export growth and increased competitiveness in high-tech products. Small scale sectors such as apparel, and meat and edible meat offal have performed poorly on the other hand. While high-tech products add to India’s growth, small scale sectors add to employment, which is critical given India’s huge population of 1.38 billion people. Economies like Vietnam has shown that economic growth and better living standards can go hand in hand. In fact, greater per capita income can result in greater human development.
Further, the exports have largely gone to a fixed set of 20 countries. Exploring new markets and diversifying exports would be a pathway India needs to explore, apart from more selective FTAs with markets where we can get better and reciprocal benefits. Along with this, creating an environment to bring in investments to boost domestic infrastructure needs to be prioritized in the new FTP.


Leave a comment