
India’s Processed F&B exports to US: Envisioning a $5 bn export target
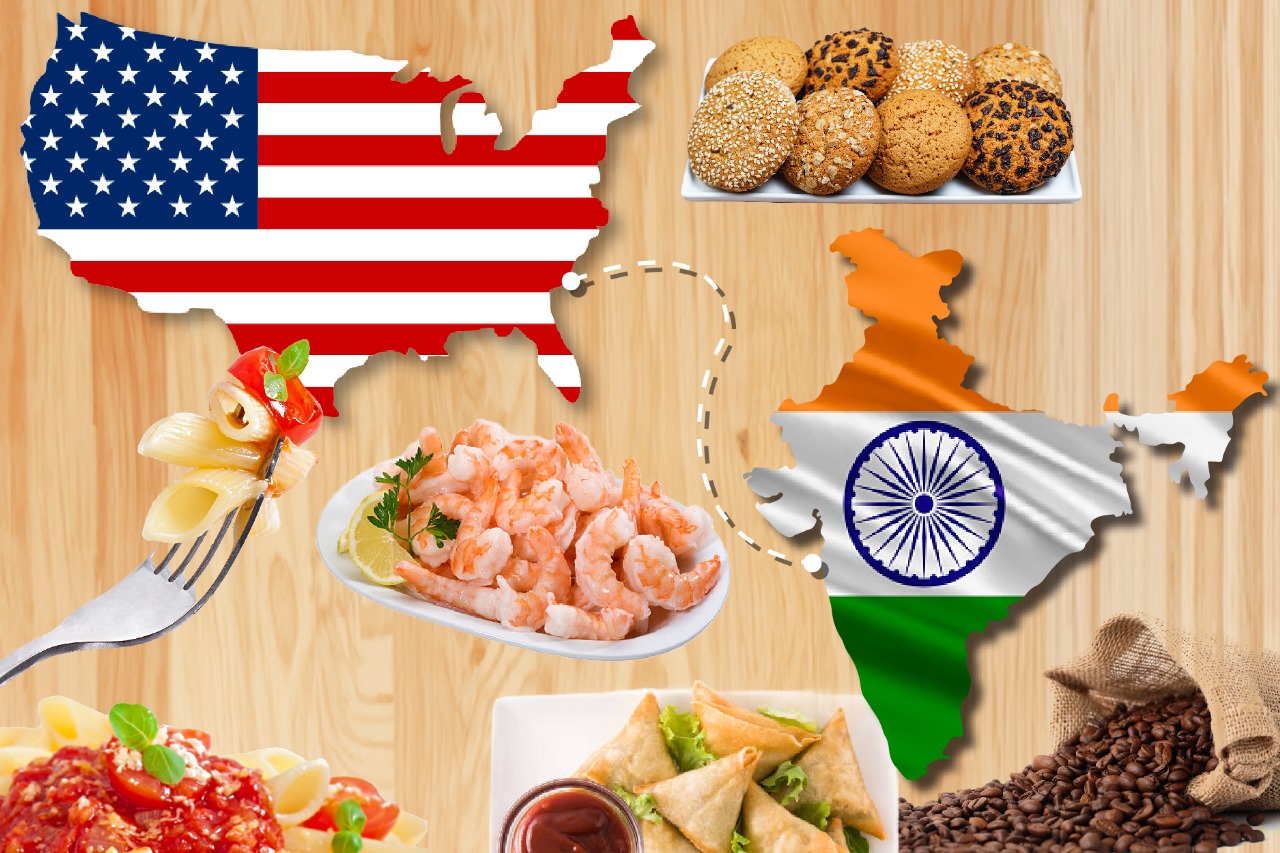
India and the US share a vision of trust and mutual understanding, with the four million-strong Indian American diaspora and robust educational exchanges acting as pillars of strength for their strategic alliance. Both countries place significant importance on their Food and Beverage sector, fostering cultural ties and economic growth through the exchange of culinary traditions, agricultural products, processed foods, and beverages.
In fact, India is showing strong growth trajectory in a number of processed food segments. If industry targets just raising its share from the present 1.5% in US Prepared Food Stuff imports to around 5%, it can raise its US exports to nearly US$ 5 billion. The Research team at The Trade Promotion Council of India (TPCI) conducted a detailed analysis to explore and assess the potential of Indian Processed and Prepared food products within the US market.
Both the US and India are ranked high in top food producing nations in the world, because of which the sector holds vast opportunities for of them to work on and build a stronger foundation. Interestingly, the US is India’s largest market for F&B exports (HS 02-22 excluding HS 05 and 06). It is ranked 7th in US’ F&B imports, which were valued at US$ 6.4 billion in 2022, showcasing a 4-year CAGR of 7% and a share of 2.95%.
For our research on the progress and potential of Indian processed food & beverage exports to the US, we have considered the following HS Codes:
Product descriptions of Prepared Foodstuffs – HS 16-22
| HS Code | Product label |
| ’16 | Preparations of meat, fish, crustaceans |
| ’17 | Sugars and sugar confectionery |
| ’18 | Cocoa and cocoa preparations |
| ’19 | Preparations of cereals, flour, starch or milk |
| ’20 | Preparations of vegetables, fruits, nuts |
| ’21 | Miscellaneous edible preparations |
| ’22 | Beverages, spirits and vinegar |
In these categories, India’s rank in US imports is much lower at 14, with a value of US$ 1.5 billion and a market share of 1.5%. On the other hand, the growth rate over the past 4 years is relatively much more impressive at around 18%. Increasing this share to just around 4% by 2028 could increase exports to nearly US$ 5 billion (assuming US processed F&B imports will continue to grow at a CAGR of around 10%), with the added benefit of capacity ramp up for India’s processed food sector. This will require only a slight acceleration in India’s processed F&B exports to the US to 22%. To achieve this objective, an overall understanding of India’s strengths, US market potential, competitive landscape, products of focus is necessary.
TPCI’s research report on Processed F&B exports to the US highlights:
- Trade trends and potential of products for Prepared foodstuffs exports to the US.
- Analysis and recommendations for shortlisted products based.
- Detailed analysis of US market and state-wise potential of processed food sector for trade and investment
- Regulatory framework for doing business in the US
- Consumer trends in the market
- Industry outlook based on interactions with businesses and consulting organisations in India and the US
According to United States Department of Agriculture, the American agriculture, food and related industries contributed roughly US$ 1.3 trillion to GDP in 2021, accounting for a 5.4% share.
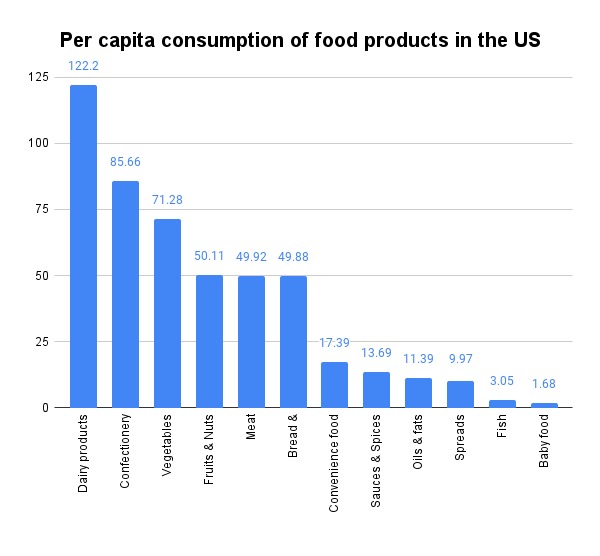
Source: Statista
The population is highly dependent on Dairy products and eggs, Vegetables, Fruits and Nuts. Meat is also among the highly consumed items. Under the prepared food categories, Confectionery, snacks, breads and cereals products also play a significant role in people’s diet. According to a research from Northeastern University’s Network Science Institute, 73% of the US food supply is ultra-processed.
In addition to this continuous reliance on processed and prepared foods, consumers are evolving their purchases based on parameters like health and wellness, safety, social impact, experience and transparency. These parameters are having pronounced effect on Processed and Prepared categories in particular. A shift towards plant-based and organic food preparations have also been witnessed, for which around 29% of the population surveyed is willing to pay extra for restaurant dishes.
Another allied industry, the food service industry is a significant one not only for the US consumers but also for the investors willing to establish in the US market. Therefore, the US market opens huge avenues for Indian prepared and processed food exporters.
Trade Analysis
The US is the largest importer of Prepared Food Stuffs (HS 16-22) in the world, with imports of US$ 95.9 billion in 2022 (16% of global imported value) and a 5-year CAGR of 9.6%.
Within this broad category, US’ import basket by country is led by Mexico (US$ 20 billion), Canada (US$ 15.7 billion), France (US$ 7.3 billion), Italy (US$ 5.9 billion) and Singapore (US$ 4.14 billion). India is ranked 12th with exports of US$ 1.5 billion, a 5-year CAGR of 17.32% and an import share of 1.6%.
Among the top 10 exporters, the most miraculous growth has been seen in the case of Singapore, which shows a 5-year CAGR of 156.45%. The next two growth leaders are Viet Nam (16.45%) and Mexico (14.2%).
Another strong point to note is the strong intra-regional trade in North America, as Mexico and Canada alone account for nearly 40% of US imports of prepared foodstuffs.
Next, we take a look at the import basket of the US for Prepared Foodstuffs at the 2-digit level. Beverages, spirits and vinegar account for a bulk 35% of imports in this grouping, followed by Preparations of cereals (15%); Preparations of Vegetables, fruits & nuts (14%) and Miscellaneous edible preparations (14%).
However, the fastest growing category over a five-year period is Miscellaneous Edible Preparations (22.22%), followed by Preparations of Cereals (13.8%) and Preparations of Vegetables, fruits & nuts (9.8%)
When it comes to imports from India, however, the equation is dramatically different. Beverages, spirits and vinegar occupy the lowest share in the basket at around 1%. On the other hand, it is dominated by Prepns. of Meat, fish and crustaceans (51%); Preparations of cereals (15%) and Preparations of vegetables, fruits & nuts (15%)
On the positive side however, nearly all categories have witnessed a strong double-digit CAGR over a five-year period (except Cocoa and cocoa preparations, led by Meat & fish (24.8%). Sugar & Sugar confectionery (21.7%) and Beverages, Spirits & Vinegar (14.4%). Below we present an overview of US import basket in Prepared foodstuffs, top exporting countries, and India’s performance over the past 4 years.
Export analysis of Prepared food stuffs to the US
| HS Code | Product label | Value imported in 2022 (US$ bn) |
Annual growth in value, 2018-22 (%, p.a.) |
Top exporting countries and share | India’s exports in 2022 (US$ mn) |
Annual growth in value between 2018-2022 (%, p.a.) |
Rank and share |
| ’22 | Beverages, spirits and vinegar | 33.73 | 7 | Mexico (34.4%), France (19.1%), Italy (10.4%) | 18.1 | 20% | #44, 0.3% |
| ’19 | Cereals, flour, starch | 14.10 | 14 | Canada (41.4%), Mexico (18%), Italy (8.4%) | 224.4 | 13% | #9, 1.6% |
| ’20 | Vegetables, fruit, nuts | 13.67 | 10 | Canada (17.6%), Mexico (14.6%), China (8.7%) | 217.3 | 13% | #17, 1.6% |
| ’21 | Miscellaneous edible preparations | 13.39 | 14 | Singapore (30.4%), Canada (16%), Mexico (7.2%) | 212.3 | 17% | #13, 1.6% |
| ’16 | Meat, fish, crustaceans… | 8.00 | 9 | Indonesia (14.9%), Thailand (14.5%), Canada (13.9%) | 772.8 | 26% | #5, 9.7% |
| ’17 | Sugars and sugar confectionery | 6.48 | 10 | Mexico (32.8%), Canada (15.3%), Germany (4.6%) | 41.5 | 15% | #27, 0.6% |
| ’18 | Cocoa and cocoa preparations | 6.31 | 7 | Canada (30.8%), Côte d’Ivoire (12.9%), Mexico (10.1%) | 32.8 | -12% | #25, 0.5% |
Source: ITC Trade Map
Out of the above, the research team surmised that HS codes 16, 19, 20 and 21 should be immediate areas of focus as India’s exports are sizeable and market share is >1%. We look at India’s top exports at 8-digit level to the US under these HS codes to understand and explore products of interest.
HS 16 Preparations of meat, of fish, of crustaceans, molluscs or other aquatic invertebrates
The top exported products by India under HS 16 at the 8-digit level are shrimps and prawns, and indeed, these also account for a majority of the country’s Prepared foodstuff exports to the US.
Trade analysis (HS 16)
| HS Code | Product | Value exported to US in 2022
(US$ mn) |
Export CAGR (2018-2022) at 6-digits |
US import CAGR (6-digit), 2018-22 |
Share in US imports (at 6-digits, 2022) |
| 16052900 | Shrimps & prawns, prpd or psvd, in airtight containers | 550.8 | 35% | 12% | 49.2% |
| 16052100 | Shrimps & prawns, prpd or psvd, not in airtight containers | 69.8 | 27% | 13% | 26.3% |
| 16051000 | Crab, prepared or preserved (excluding smoked) | 55.3 | 14% | 4% | 6.9% |
| 16042000 | Prepared or preserved fish (excluding whole or in pieces) | 37.7 | 32% | 11% | 17.5% |
| 16055400 | Cuttlefish and squid, prepared or preserved (excluding smoked) | 1.8 | 32% | 12% | 2.4% |
Source: ITC Trade Map, NA – Information not available
India already has a high market share in Shrimps and prawns in airtight containers at around 50%. Similarly, it is slightly behind Indonesia in HS 160521 (shrimps and prawns not in airtight containers). Exports of Cuttlefish and squid are also growing strongly, despite India’s low share of 2.4%. The top exporters of this product to the US are China, Thailand and Spain.
HS 19- Preparations of cereals, flour, starch or milk…
Pasta is one category where the US market is growing at a strong CAGR but Indian exporters are unable to capitalize. On the other hand, India’s exports are more or less in tandem with the US market in Bread, pastries, cakes, sweet biscuits and prepared food by swelling/roasting cereals. We need to capitalize further on these categories.
Trade analysis (HS 19)
| HS Code | Product | Value Exported to US in 2022
(US$ mn) |
Export CAGR at 6-digits (2018-22) | US import CAGR (6-digit), 2018-22 |
Share in US imports (at 6-digits, 2022) |
| ‘19059090 | Bread, pastry, cakes, biscuits… | 41.7 | 14% | 15% | 2.3% |
| ‘19053100 | Sweet biscuits | 33.4 | 12% | 11% | 1.1% |
| ‘19023010 | Pasta | 7.7 | -3% | 15% | 0.5% |
| ‘19059020 | Bread, pastry, cakes, biscuits | 6.2 | 14% | 15% | 2.3% |
| ‘19041090 | Prepared foods by swelling or roasting cereals… | 6.1 | 15% | 13% | 1.9% |
Source: ITC Trade Map
HS 20– Preparations of vegetables, fruits and Nuts…
India is the market leader in exports of Cucumbers and gherkins, while it has a very low share in Vegetables preserved by Vinegar. However, India’s growth rate is quite good in Jams, jellies and marmalades, and this product category needs to be pushed further.
Trade analysis (HS 20)
| HS Code | Product | Value Exported to US in 2022
(US$ mn) |
Export CAGR at 6-digits (2018-22) | US import CAGR (6-digit), 2018-22 |
Share in US imports (at 6-digits, 2022) |
| ‘20011000 | Cucumbers and gherkins, prepared .. | 46.6 | 17% | 16% | 61% |
| ‘20059900 | Vegetables preserved not by vinegar.. | 28.7 | 12% | 9% | 6.6% |
| ‘20049000 | Vegetables preserved by vinegar.. | 20.2 | 17% | 14% | 0.7% |
| ‘20081910 | Nuts and other seeds.. | 17.8 | 3% | 11% | 3.5% |
| ‘20079910 | Jams, jellies, marmalades… | 12.8 | 23% | 16% | 3.5% |
Source: ITC Trade Map
In nuts and other seeds category, the US market is showing strong import growth, but India is not able to capitalize, as indicated by its significantly lower growth rate.
HS 21- Miscellaneous edible preparations
India’s growth in coffee extracts and sauce preparation//s is well below the growth rate of US imports, showing that we are not capitalizing well on the market potential. On the other hand, in Food preparations nes, India is growing at over twice the rate of US import growth and stands to gain market share rapidly if it is able to maintain this pace.
Trade analysis (HS 21)
| HS Code | Product | Value Exported to US in 2022
(US$ mn) |
Export CAGR at 6-digits (2018-22) | US import CAGR (6-digit), 2018-22 |
Share in US imports (at 6-digits, 2022) |
| ‘21069099 | Food preparations, n.e.s… | 135.5 | 29% | 12% | 1.3% |
| ‘21011190 | Extracts, essences and concentrates, of coffee | 29.5 | 7% | 17% | 7.4% |
| ‘21011120 | Extracts, essences and concentrates, of coffee | 23.6 | 7% | 17% | 7.4% |
| ‘21012010 | Extracts, essences and concentrates, of tea | 14.0 | 13% | 10% | 8.1% |
| ‘21039040 | Preparations of sauces | 5.4 | 9% | 16% | 1.2% |
Source: ITC Trade Map
Final categorization of products
Based on the preliminary analysis of comparative size, market share and growth rates, we have divided the above product segments across HS codes 16, 19, 20 and 21 into four categories. Details of this final demarcation are provided in the table below.
Category-wise selection of Prepared foodstuff exports to the US
| High market share >25% | Low market share
<10% |
||
| Category 1 High market share, low upside potential |
Category 2 High performance, export growth significantly exceeds US import growth |
Category 3 At par performance, export growth in tandem with US import growth |
Category 4 Weak performance, export growth significantly lower than US import growth |
| Shrimps & prawns, prpd or prsvd, in/not in airtight containers | Jams, jellies, marmalades | Bread, pastries, cakes, biscuits | Extracts of coffee |
| Food preparations nes | Sweet biscuits | Preparations of sauces | |
| Cucumbers & gherkins, preprd or preserved | Crabs, prpd or prsvd | Prepared food by roasting of cereals, cornflakes | Preparations of nuts and other seeds |
| Prepared or prsvd fish | Preserved Vegetables with or without vinegar | Pasta | |
| Cuttlefish & squid | Extracts and concentrates of tea | ||
Based on the above conclusion, the products under Category 2 are doing significantly better than US imports and can gain the most from a strong coordinated impetus by all stakeholders. The next category of focus should be Category 3, where India’s performance is at par with the market’s growth rate. Finally Category 4 needs to be analysed to understand the issues that are being faced in these areas that are preventing Indian exporters to effectively compete in the market.
To access the complete report containing our indepth insights on India’s processed F&B export potential to the US, please contact researchdesk3@tpci.in


Leave a comment