
Post-COVID macroeconomic risk analysis of leading global economies
Centre for Advanced Trade Research, TPCI, analyses macroeconomic risk scores of leading economies of the world and where India stands post-COVID-19. Results show that India needs to prioriise the health of its long term macoroeconomic parameters to emerge as a lucrative investment destination.
• Macroeconomic risk is an aggregate reflection of economic health for a nation, which gets impacted by several factors like political stability, financial soundness, socio-economic standing, development indicators, governance, etc.
• Investors consider a country’s risk score to understand, observe and compare its worthiness with other countries. They can take action either by investing directly into a country or into regionally oriented funds.
• Singapore leads the chart on economic indicators according to our analysis, with a score of 92.071 followed by Switzerland, Hong Kong and Denmark.
• India’s position is not encouraging as out of 60 economies analysed, its rank is 56th with a moderate score of 53.67. Now this is due to negative current account balance, low forecasted GDP and low GDP per capita. Countries ranking below India include South Africa, Belarus, Ukraine and Syria.
Macroeconomic risk is an aggregate reflection of economic health for a nation, which gets impacted by several factors like political stability, financial soundness, socio-economic standing, development indicators, governance, etc. Macro risk can be intrinsic in nature, or it can be caused by factors or events outside the country’s control. Common examples of macro risk include changes in fiscal policies, banking policies, trade policies, shifts in the regulatory tax regime or political or civil unrest. It is known to have a major impact on the decision-making process of foreign companies when it comes to doing business or making investments. Obtaining a country’s risk score is of great importance to multinational corporations and global policy makers.
The current COVID-19 crisis has significantly enervated the economic health of nations. GDP growth rate forecasted by IMF states that the global economy will squeeze by 2-5% in 2021. Similarly, WTO projects world trade to plummet by 13-32% in the coming year. Due to a heavy fiscal stimulus given by leading economies across the world, financial robustness has been adversely affected, which could be corroborated by looking at the current account balance of an economy.
Investors consider a country’s risk score to understand, observe and compare it’s attractiveness for business vis-a-vis the competition. They can either investing directly into the country or stake their money into regionally oriented funds. Considering that investors and businesses across the globe must be reassessing their investment priorities to channelize their capital post-COVID, CATR (Centre for Advanced Trade Research, a division of Trade Promotion Council of India) undertook an exhaustive statistical analysis to assess the macroeconomic scores of leading economies to assess the soundness of their economic health. For this exercise, after examining various literatures on macroeconomic risk score, we have formulated our methodology in line with the International Country Risk Guide (ICRG). Four broad categories of indicators were framed, which are:
1. Economic
2. Political and Regulatory
3. Financial and Trade
4. Social
Under Economic Indicator category, 10 macroeconomic indicators were incorporated, each with a separate score, as suggested in The International Country Risk Guide (ICRG), though with some aberration in scoring the variables and assigning weights to the four broad indicators. Simultaneously, these indicators were validated using PCA (Principal Component Analysis). Since these economic variables are relatively volatile in nature, an average value from 2010-2018 is considered under this category, except for forecasted GDP growth rate for 2021, so that COVID impact can be captured. Throughout the analysis, higher scores, means low risk. A country with maximum score in the end will have least risk. Some economic variables are less in intensity for favourable and robust macroeconomic environment like unemployment or inflation or fragile index of a state. Thus, these are converted or scored accordingly that high scores mean desired macroeconomic outcome.
Ten variables under economic indicator category along with their weights are as follows:
I. Forecasted economic growth (10%)
II. GDP per capita at Purchasing Power Parity (5%)
III. Inflation: percentage change in the Consumer Price Index (10%)
IV. Current account balance as percent of GDP (15%)
V. Unemployment rate (10%)
VI. Economic globalization index (10%)
VII. Business freedom index (10%)
VIII. Investment freedom index (10%)
IX. Foreign Reserves Per capita (10%)
X. Innovations index (10%)
Highest weightage is given to current account balance factor, because it reflects the ability to absorb the impact of the crisis by having the degree of freedom to expand fiscal expenditure. Obviously if country’s current account balance is in negative, then it dilutes the macroeconomic outlook, which may debilitate the confidence of investors. Based on the directions of ICRG, following are CATR’s scores given for different current account balance figures:
Scoring framework for Current Account Balance
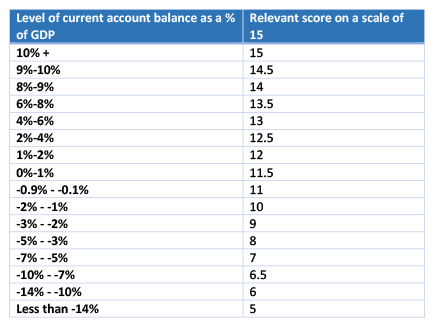
Source: CATR’s score
According to the economic indicator score which is calculated out of 100, following are the top 10 economies as compared with India:
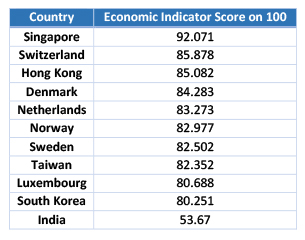
Source: CATR’s Calculations
Singapore leads the chart on economic indicator with a score of 92.071, followed by Switzerland, Hong Kong and Denmark. Now, this indicates that even after the COVID crisis, these economies reflect a relatively robust economic outlook. India’s position is not encouraging, as out of 60 economies analysed, its rank is 56 with a moderate score of 53.67. This is due to negative current account balance, low forecasted GDP and low GDP per capita. Countries ranking below India are South-Africa, Belarus, Ukraine and Syria.
Let’s come to other three categories which are also incorporated to evaluate macroeconomic risk score. Those indicators, which were indexed already in symmetrical manner, were converted into scores. For example, political stability index is provided by government indicators and has a value between -2.5 to 2.5. Since absolute scores were required on a scale of 1 to 10, +2.5 was added and then it was multiplied by 2. While in second methodology, only ranks were needed, thus, it was taken as it is.
Second broad indicator is political and regulatory indicator. Again, 10 indicators are considered here, which are listed in appendix. Each had a weightage of 10, making the combined score 100. Third category is financial and trade indicator. Under this, category, seven indicators are incorporated, again listed in appendix. Total score of 65 was obtained, which was then converted on equivalent scale of 100. Fourth category is social indicator, which has three indicators i.e. happiness index, social globalization index and fragile state index. Combined score of 30 is then converted on an equivalent scale of 100.
Lets’ have a look at top 10 economies as per the second, third and fourth criteria.
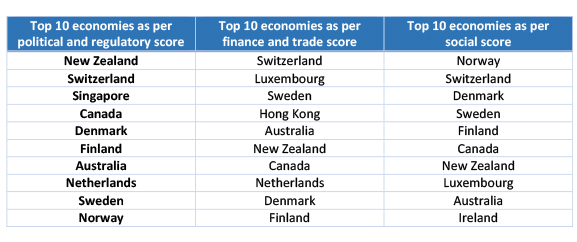
Source: CATR’s calculations.
After adding all the components, two different weights were used to evaluate credit score on a scale of 100. Generally, literature suggests political stability should be given more weight. Also, international country risk guide methodology suggests 50% weight to political stability. So, we have given 40% weight to political and regulatory indicator, 30% to economic indicator, 20% to financial and trade indicator and 10% to social indicator.
Macroeconomic score = (0.3*Economic Indicator) + (0.4*Political & Regulatory Indicator) + (0.2*Financial and Trade Indicator) + (0.1*Social Indicator).
In total, 30 indicators were incorporated. According to the final macroeconomic risk score, Switzerland, Singapore and Denmark are the top three economies with maximum macroeconomic robustness. Following table lists top ten economies as per their macroeconomic scores:
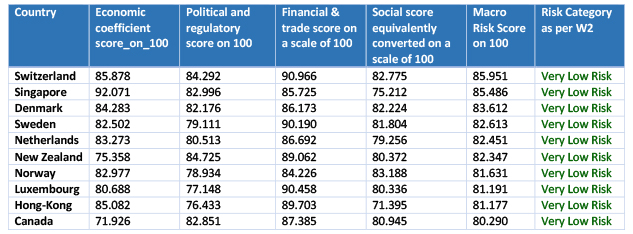
Source: CATR’s calculations.
For all 60 countries score, kindly refer the graph.
Source: CATR’s calculation
Appendix
List of Indicators
Political and Regulatory Indicator
I. Rule of law index (-2.5 weak; 2.5 strong)
II. Government effectiveness index (-2.5 weak; 2.5 strong)
III. Control of corruption (-2.5 weak; 2.5 strong)
IV. Regulatory quality index (-2.5 weak; 2.5 strong)
V. Voice and accountability index (-2.5 weak; 2.5 strong)
VI. Political stability index (-2.5 weak; 2.5 strong)
VII. Corruption Perceptions Index, 100 = no corruption
VIII. Political globalization index (0-100)
IX. Fiscal freedom index (0-100)
X. Fiscal freedom index (0-100)
Each had a weightage of 10, making the combine score to 100.
Financial and Trade Indicator
I. Government debt as percent of GDP (on Score of 5)
II. Monetary freedom index (0-100, on Score of 10)
III. Trade freedom index (0-100, on Score of 10)
IV. Financial freedom index (0-100, on Score of 10)
V. Non-performing loans as percent of all bank loans (on score of 15)
VI. S&P country ratings (on a score of 10)
VII. Logistics performance index (on a scale of 5)
Total score of 65 was obtained, which was then converted on equivalent scale of 100.


Leave a comment