
Will RCEP withdrawal hurt India’s chemical industry?
Indian chemical exports to RCEP member countries have been witnessing strong growth over the past few years. But preferential access to RCEP members could put Indian chemical companies at a disadvantage.
IBT takes a closer look at the possible repercussions of the deal in the case of China, which happens to be India’s largest chemical exports market.
- Globally, India is the 14th largest exporter and 8th largest importer of chemical products.
- On average, 23.6% of India’s chemical exports go to RCEP member countries while 16.2% of imports of chemicals get imported from RCEP members.
- Among the RCEP members, China is the largest market for India’s chemicals, accounting for 9.09% in India’s chemical exports.
- CATR analysis shows that India can lose share in China’s chemicals market to Japan and South Korea, considering that they are strong competitors and stand to benefit from tariff reductions.

India’s decision to withdraw from the RCEP agreement, which was signed by ASEAN countries and their FTA partners – Japan, South Korea, China, Australia and New Zealand – can be viewed from several angles. While India is logically correct to be concerned about a potential surge in imports and the presence of China, it is also true that staying away from the world’s largest Free Trade Area carries disadvantages.
Countries within the RCEP are looking forward to tap the potential of reduced trade barriers to a huge economic zone with a total GDP of US$ 26.2 trillion (30% of world GDP) and market size of 2.2 billion people. A World Trade Centre report estimated that India stands to gain market share in 24 identified product categories if it improves its competitiveness, with potential export gains amounting to US$ 125 billion.
Naturally, while there are quite a few industries that have opposed RCEP on the grounds of enhanced competition, there are a few globally competitive sectors that would actually rue India’s withdrawal as a missed opportunity.
One such instance is the chemical industry, where India is among the world’s top players, ranking 6th in production. Over the past five years, this industry has shown significant growth in both exports (CAGR of 10.02%) and imports (CAGR of 6.79%). Presently, India ranks 14th in terms of exports of chemicals and 8th in terms of imports of chemicals in the world.
On an average, 23.6% of India’s chemical exports in the past five years have been destined for RCEP member countries. Furthermore, 16.2% of chemical imports in India have been sourced from this region. India has a negative balance with the RCEP members, recorded at US$ 18.4 billion in 2019. But one cannot ignore that between 2015 and 2019, India’s chemical exports to RCEP members have increased at a CAGR of 17.84%, while imports have grown at a CAGR of 9.79%.
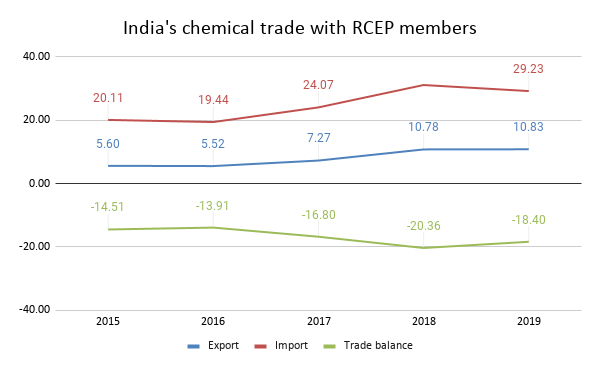
Source: UN Comtrade, figures in US$ billion
The top ten exported products to RCEP members constitute 60% of India’s chemicals exports to RCEP members. In terms of imports from RCEP members, the top ten products constitute 36.7% of the total import from RCEP members.
Table 1: Top exported products by India to RCEP members countries
| HS Code | Products | Exports (US$ million) in 2019 | Share (%) |
| 2902 | Cyclic hydrocarbons | 2,612.37 | 24.12 |
| 3901 | Polymers of ethylene, in primary forms | 824.15 | 7.61 |
| 3204 | Synthetic organic colouring matter, whether or not chemically defined; preparations based on | 799.97 | 7.39 |
| 3808 | Insecticides, rodenticides, fungicides, herbicides, anti-sprouting products and plant-growth | 576.05 | 5.32 |
| 2933 | Heterocyclic compounds with nitrogen hetero-atom[s] only | 533.41 | 4.93 |
| 2906 | Cyclic alcohols and their halogenated, sulphonated, nitrated or nitrosated derivatives | 330.59 | 3.05 |
| 2909 | Ethers, ether-alcohols, ether-phenols, ether-alcohol-phenols, alcohol peroxides, ether peroxide | 277.49 | 2.56 |
| 2941 | Antibiotics | 227.37 | 2.10 |
| 2901 | Acyclic hydrocarbons | 210.45 | 1.94 |
| 3902 | Polymers of propylene or of other olefins, in primary forms | 210.03 | 1.94 |
Source: UN Comtrade
Table 2: Top imported products in India from RCEP
| HS Code | Products | Imports (US$ million) in 2019 | Share (%) |
| 2933 | Heterocyclic compounds with nitrogen hetero-atom[s] only | 1,512.02 | 5.17 |
| 2902 | Cyclic hydrocarbons | 1,378.57 | 4.72 |
| 3907 | Polyacetals, other polyethers and epoxide resins, in primary forms; polycarbonates, alkyd resins | 1,245.18 | 4.26 |
| 3904 | Primary forms | 1,153.98 | 3.95 |
| 2941 | Antibiotics | 1,091.8 | 3.74 |
| 2818 | Artificial corundum, whether or not chemically defined; aluminium oxide; aluminium hydroxide | 935.65 | 3.20 |
| 2915 | Saturated acyclic monocarboxylic acids and their anhydrides, halides, peroxides and peroxyacids | 908.43 | 3.11 |
| 3901 | Polymers of ethylene, in primary forms | 861.98 | 2.95 |
| 3808 | Insecticides, rodenticides, fungicides, herbicides, anti-sprouting products, and plant-growth | 850.01 | 2.91 |
| 2917 | Polycarboxylic acids, their anhydrides, halides, peroxides, and peroxyacids; their halogenated | 788.66 | 2.70 |
Source: UN Comtrade
Under RCEP, a commitment has been made to liberalize the trade of goods among the signatory members by eliminating tariffs within 20 years from the time the agreement comes into effect. This can impact India’s exports of chemical products; since member countries include the world’s top chemical players. India has a 2.26% share in global exports of chemicals, which is less than the share of China (13.09%), South Korea (4.73%), and Japan (4.59%), the non-ASEAN members of RCEP.
In order to understand the prospects of India’s exports of chemicals to RCEP members, we look at its largest chemicals market (not just in RCEP but also globally). Ironically, that market is China, one of the major drivers of India’s decision to opt out of the deal. During 2015-19, China accounted for 9.09% of India’s chemical exports. Figure 2 below shows China’s import of chemicals from India and RCEP member countries during 2015-2019. Imports from India have increased at a CAGR of 22.31%, while in the case of RCEP members, the CAGR is 4.34%, although the base effect is too significant here.
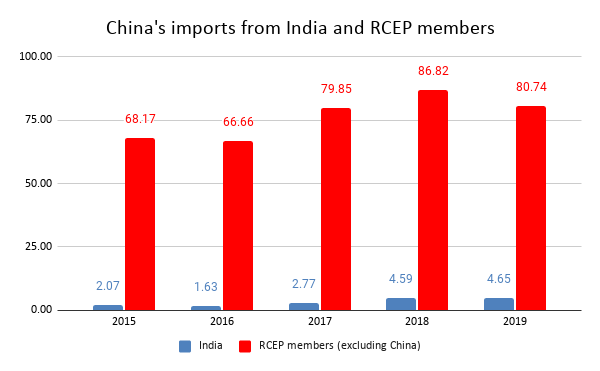
Source: UN Comtrade, figures in US$ billion
As a result of RCEP, the member countries that export to China would progressively be facing reduced tariff costs. However, China already has an FTA with the ASEAN, known as ASEAN-China Free Trade Area (ACFTA), which implies that these countries are already benefitting from reduced tariffs. Thus, we have limited our analysis to non-ASEAN members of RCEP. Table 3 below shows the top exported chemical products by India to China, where India has a share of at least 5% in China’s total imports of the product.
Table 3: Top competitors of India in China’s chemical market
| HS Code | Product | Country | Share in China’s imports of the product (%) | Share in World’s Exports of the product (%) |
| 290243 | P-Xylene | Korea, Republic of | 40.1 | 31.6 |
| Japan | 13.9 | 15.9 | ||
| India | 8.6 | 13.2 | ||
| 390120 | Polyethylene with a specific gravity of >= 0,94, in primary forms | Korea, Republic of | 10.6 | 5 |
| India | 5.1 | 1.8 | ||
| Japan | 1.4 | 0.7 | ||
| 290611 | Menthol | India | 86.9 | 42.1 |
| Japan | 2 | 3.6 | ||
| 290220 | Benzene | Korea, Republic of | 56.1 | 28 |
| India | 7.8 | 15.2 | ||
| Japan | 8.1 | 6.1 | ||
| 320417 | Synthetic organic pigments; preparations based on synthetic organic pigments of a kind used | India | 23.5 | 15.4 |
| Japan | 14.5 | 5.2 | ||
| Korea, Republic of | 23 | 3.4 |
Source: UN Comtrade
It is clear from the above table that among non-ASEAN members of the RCEP agreement, Japan and South Korea are the largest competitors for India, which have a significant share in China’s imports. For instance, in the case of P-Xylene, South Korea has a share of 40.1% and Japan has a share of 13.9% in China’s total imports of the product while India’s share is 8.6%. In terms of global exports of this product also, South Korea and Japan have higher shares i.e., 31.6% and 15.9% respectively while India’s share is 13.2%.
Under RCEP, the tariff on the product imposed by the RCEP members would be reduced gradually in the 20 years starting from the year in which the agreement comes into effect. Table 5 below shows the tariffs that are offered by China to Japan and South Korea under RCEP and the tariffs imposed by China on India for the products identified above. For the comparison, it has been assumed that the tariff rate imposed by China on India for different products would remain unchanged, at least for 20 years from the implementation of the RCEP agreement.
Table 4: Tariff imposed by China
| HS Code | Product | India | Japan | South Korea |
| 290243 | P-Xylene | 2 | 2 | 2 |
| 390120 | Polyethylene with a specific gravity of >= 0.94, in primary forms | 6 | 6.5 | 6.5 |
| 290611 | Menthol | 5 | 0a | 0a |
| 290220 | Benzene | 2 | 1.4b | 1d |
| 320417 | Synthetic organic pigments; preparations based on synthetic organic pigments of a kind used | 4.2 | 5.9c | 0a |
a0 from year 1
b1.4 in year 5, 0.8 in year 10, 0.1 in year 15, and 0 in year 16
c5.9 in year 1, 3.5% in year 5, 0.6% in year 10 and 0 in year 11
d1% in year 5, 0% in year 10
Source: Department of Foreign Affairs and Trade, Australia Government and Market Access Map, ITC trade map, figures in %
For P-Xylene and Polyethylene with a specific gravity of at least 0.94, the tariff imposed by China is the same for India, South Korea, and Japan, as is shown in table 4. For Menthol, the tariff imposed by China in the case of India is 5% whereas, in the case of Japan and South Korea, the rate is 0% from the 1st year after the implementation of RCEP. For Benzene also, China imposes a 2% tariff on India while for Japan and South Korea, the tariff would be less than 2% from the 5th year onwards. While it would be less than 1% for Japan and South Korea after 10 years. For synthetic organic pigments and its preparations, the tariff imposed by China on India is 4.2% while for Japan, it would be 0 from year 1 after the agreement comes into effect. For South Korea, the tariff would be less than 4.2% from the 5th year onwards.
Thus, it is evident that India would be facing higher custom tariffs than Japan and South Korea for some chemical products implying differential tariff costs to the countries. This can result in the loss of India’s share in the export of chemical products to China, ceteris paribus. To avoid the loss, it would be essential for the industry to preserve its exports by diversifying its export market or to look for ways to enhance their competitiveness in the RCEP market.


Leave a comment