
Understanding India’s export outperformance
The Indian economy is standing out among major economies in terms of rebound in exports. Growth in exports of goods during Jan-Jun 2021 stood at 46.9% yoy, while import growth equalled 50%. This infographic analyses the key drivers behind India’s export performance and the expected trade trajectory going forward.
- According to UNCTAD, world trade in Q1 2021 grew by 4% quarter over quarter, with 10% year over year (yoy) growth.
- Comparison of its trade growth with other major economies classified on the basis of nominal GDP shows that India is outperforming other economies.
- Exports of engineering products have experienced a rise to all the destinations, while exports of petroleum products has increased owing to rise in crude oil prices.
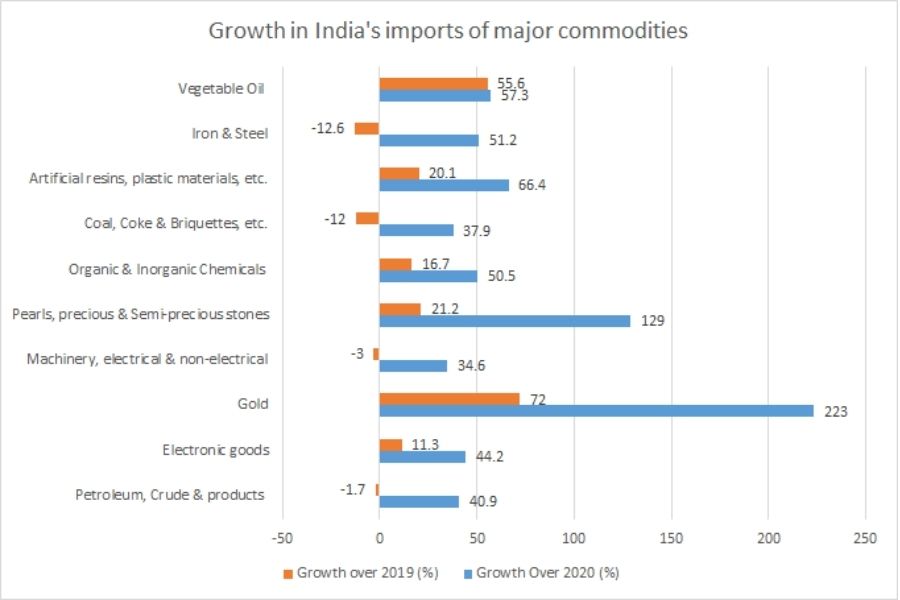
- Import of gold reached a record high of US$ 11.35 billion in January-August 2021, experiencing a growth by 223% yoy. Gold imports constitute 10% of total imports during this period.

The year 2021 has brought along with it recovery in trade for countries, with major economies reporting positive growth in 2021. According to UNCTAD, world trade in Q1 2021 grew by 4% quarter over quarter, with 10% year-over-year (yoy) growth. Furthermore, merchandise trade went above and beyond the pre-pandemic levels as well, whereas trade of services remained below the pre-pandemic level. While imports have increased for almost all the economies, the export rebound is mainly attributed to growth in East Asian economies. In 2021, bets are placed on China and the US to show strong rebound in trade, while connected economies such as East Asian nations, Mexico and Canada also expect to post gains.
These trends of growth can be seen in India’s trade as well. While not leading in terms of absolute value of trade, the Indian economy is standing out in terms of rebound. Comparison of its trade growth with other major economies, where economies are ranked on the basis of nominal GDP in 2020, shows that India is a notable outperformer.
| Trade growth in major economies | |||
| Country | Jan-Jun 2021 (US$ Billion) | YoY growth (%) | |
| United States | Exports | 840 | 22.2 |
| Imports | 1,381.70 | 24.5 | |
| China | Exports | 1,518.40 | 38.6 |
| Imports | 1,266.80 | 36 | |
| Japan | Exports | 369.7 | 23.7 |
| Imports | 360.8 | 12.8 | |
| Germany | Exports | 811.1 | 27.6 |
| Imports | 635.7 | 26.2 | |
| United Kingdom | Exports | 226.9 | 16.9 |
| Imports | 323.1 | 17 | |
| India | Exports | 186 | 46.9 |
| Imports | 257.7 | 50 | |
Source: ITC Trade Map and Ministry of Commerce and Industry
India’s growth in exports of goods during Jan-Jun 2021 is 46.9% yoy while imports have grown by 50% yoy. These growth rates are highest in comparison to China, United Kingdom, United States, Japan, and Germany.
Transcending pre-pandemic levels
Data from the Ministry of Commerce and Industry shows that exports and imports of India have even surpassed their 2019 levels. Growth for exports and imports of India in Jan-Aug 2021 stood at 47% and 51.4% YoY respectively. Furthermore, in comparison to Jan-Aug 2019, exports and imports have grown by 16.2% and 5.7%, respectively.
The export rebound remains robust as global trade is recovering. The big support from the export sector, which is due to faster growth in developed economies, is adding to India’s aggregate demand. Import recovery shows signs of revival of demand and support for the industries, which are import dependent.
Commenting on the demand revival in India, Shaktikanta Das, Governor of Reserve Bank of India has said,
“Some of the indicators, like the sale of fast moving consumer goods or consumer durable are showing considerable amount of improvement. So, by the end of the year, I would expect consumer demand to have increased substantially over the current levels or over the levels where the COVID-19 impact took them down.”
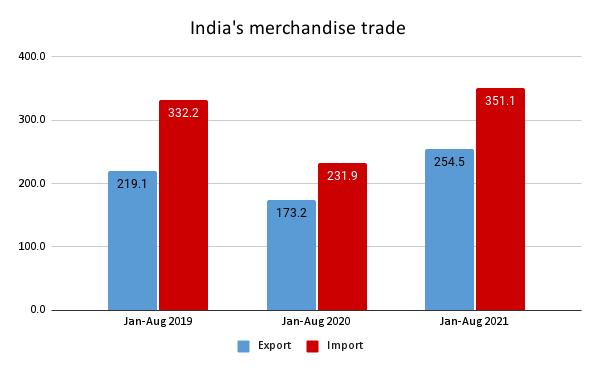
Source: Ministry of Commerce and Industry, figures in US$ billion
Persistent growth in India’s merchandise’s exports and imports has led to widening trade deficit, which reached US$ 13.9 billion in August 2021 in comparison to US$ 8.2 billion during August 2020.
Commodities pushing trade growth
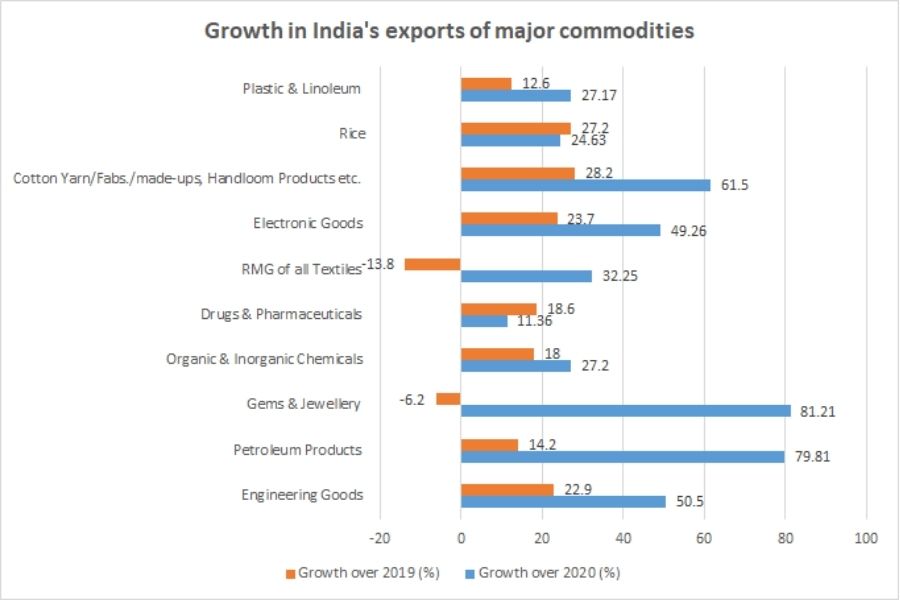
All major products, which account for 80% of India’s exports of goods, have experienced double digit growth. These exports are driven by engineering goods, petroleum products, gems and jewellery, organic and inorganic chemicals and drug and pharmaceuticals.
Exports of engineering products have experienced a rise to all the destinations. Petroleum products have also driven exports, with exports realisation of these products highly dependent on crude oil prices. Brent crude oil price was at US$ 72.9 per bbl on September 10 compared to US$ 65.2 per bbl on August 20, 2021. Petroleum products constitute around 10% of India’s total merchandise exports.
Commenting on the rise in oil exports, Aditi Nayar, Chief Economist at ICRA, said,
“A spike in oil exports boosted the overall merchandise exports to a record high level in July. A sustenance of oil exports at this level would significantly boost the expansion in merchandise exports in FY22.”
Exports of these goods have also grown beyond the export levels in the pre-pandemic period, except for gems and jewellery and readymade garments of all textiles. New export orders, driven by positive growth in international demand, are also driving manufacturing activities of the Indian economy. IHS Markit’s purchasing managers’ index (PMI) for manufacturing activity was 52.3 in August 2021 implying expansion in domestic manufacturing activities, though it’s a decline from 55.3 in July 2021 as demand showed signs of weakness. Export orders showed positive growth in the month of August 2021, though the pace growth softened slightly.
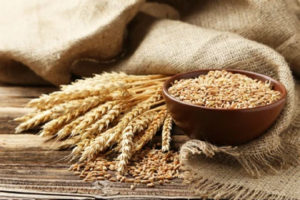
Products accounting for 80% of India’s imports have witnessed at least double digit YoY growth in 2021. Import of gold reached a record high of US$ 11.35 billion in January-August 2021, experiencing growth of 223% yoy. Gold imports constitute 10% of total imports during this period. The rise in import can be attribute to revived demand in economy post the second wave of pandemic and weaker gold prices during the months.
Prices of gold fell to its lowest in the past four months, reaching Rs. 45,670 per 10 grams on 10th August 2021. Similarly imports of other products have seen positive growth in 2021. Furthermore, in comparison to 2019, except for petroleum and crude products, machinery and electrical, coal, coke and briquettes and iron & steel, imports of all other products have seen positive growth.
Source: Ministry of Commerce and Industry
Source: Ministry of Commerce and Industry
Country wise trade growth
Exports to top destinations have grown at double digits in Jan-July 2021. India’s largest export destinations i.e., US and China have recovered from the fall in 2020 and witnessed growth in imports above the pre-pandemic levels. In comparison to Q1 2019, import of US and China increased by 7% and 20% respectively in Q1 2021. India’s exports to its major destinations have experienced positive growth.
Exports to Bangladesh in Jan-Jun 2021 rose to US$ 6.9 billion, growing by 115.4% yoy. Demand for agricultural products and relatively fewer hurdles in transporting goods to this neighboring country have contributed to rising exports. Exports of agricultural products to Bangladesh increased by 195.8% yoy in Jan-Jul 2021, while in comparison to Jan-Jul 2019, exports were up by 252.19%. Similarly, exports to other leading destinations as well witnessed double digit growth in Jan-July 2021.
India’s imports from top destinations in 2021 also posted double digit growth in comparison to 2020. China, United States and UAE remained India’s top sources for merchandise imports in Jan-July 2021. Furthermore, growth in imports from Switzerland mainly expanded due to India’s increased shipments of gold from Switzerland. During Jan-July 2021, 50% of India’s total gold imports came from Switzerland, resulting in increase in total imports from the latter by 291.2% yoy.
| Export growth by country | Import growth by country | ||||||
| Country | Jan-July 2020 | Jan-July 2021 | YoY growth | Country | Jan-July 2020 | Jan-July 2021 | YoY growth |
| US | 25.38 | 38.75 | 52.69 | CHINA P RP | 29.95 | 47.52 | 58.6% |
| China PRP | 10.98 | 14.82 | 34.97 | U S A | 15.49 | 23.22 | 49.9% |
| UAE | 10.70 | 14.09 | 31.71 | U ARAB EMTS | 12.06 | 22.82 | 89.2% |
| Bangladesh PR | 4.06 | 7.86 | 93.6 | SWITZERLAND | 4.13 | 16.32 | 295.6% |
| Hong Kong | 4.98 | 6.97 | 39.79 | IRAQ | 10.13 | 13.75 | 35.7% |
| Singapore | 4.92 | 6.86 | 39.28 | SAUDI ARAB | 10.34 | 13.14 | 27.1% |
| UK | 3.99 | 5.82 | 46.03 | SINGAPORE | 6.61 | 10.14 | 53.3% |
| Germany | 4.08 | 5.40 | 32.36 | HONG KONG | 7.33 | 9.61 | 31.1% |
| Nepal | 2.97 | 5.18093 | 74.58 | KOREA RP | 6.80 | 9.37 | 37.8% |
Source: Ministry of Commerce and Industry
Way ahead
The data discussed indicates that during January-June 2021, India has fared well in comparison to other major economies in export growth. Given that demand remains robust, imports are likely see further growth in in coming months. Aditi Nayar adds, “Unless a weaker agricultural outlook restrains demand, gold imports may well touch US$ 40 billion in FY 2021-22.”
In exports, a hurdle in the growth is container shortage issue, a by-product of the economic uncertainties caused by the COVID-19 pandemic. The shortage is resulting in increase in trade cost and long wait for availability. On this issue, Ashish Agarwal, Director, Bhikharam Chandmal Bhujiawala Pvt. Ltd., commented,
“Availability of vessels is weak. Previously, it was very quick and now even after commitments, there is no loading. Also, when the market is all time high on raw material prices, freight rates have also gone up by five times. A container which used to have a freight component of 10-15% previously now has 70-80% freight component. Thus, a Rs. 10 product which used to cost Rs. 12 when it reached US now costs Rs. 18 due to freight. Besides, the manufacturers wants to raise the price by 15-20%.”
A solution to this would be a further push to export growth of India. One way to over come this crisis is faster clearance of containers, especially the authorized economic operators for trade. Government and industry could also consider leveraging alternative routes, for instance, selecting ports as transshipment ports that have less congestion with faster transit time. Overall, the government’s outlook for India’s merchandise export growth in 2021 is positive toward achieving the US$ 400 billion target with exports of both petroleum and non-petroleum products rising.


congratulations for presenting great paper