
Tricky journey to the heart of Japan
The Indo-Japan relationship has blossomed across spheres, but the same has not translated into gains for India in terms of FDI as well as access to the Japanese market. Both sides need to work on aggressive trade promotion, while Japan needs to bring down its regulatory and import barriers for products of India’s interest. On the other hand, considering the inward-looking approach being shown by the latter, India will have to proactively plug into Japanese value chains to benefit from investments and technology transfer in the post-COVID era.
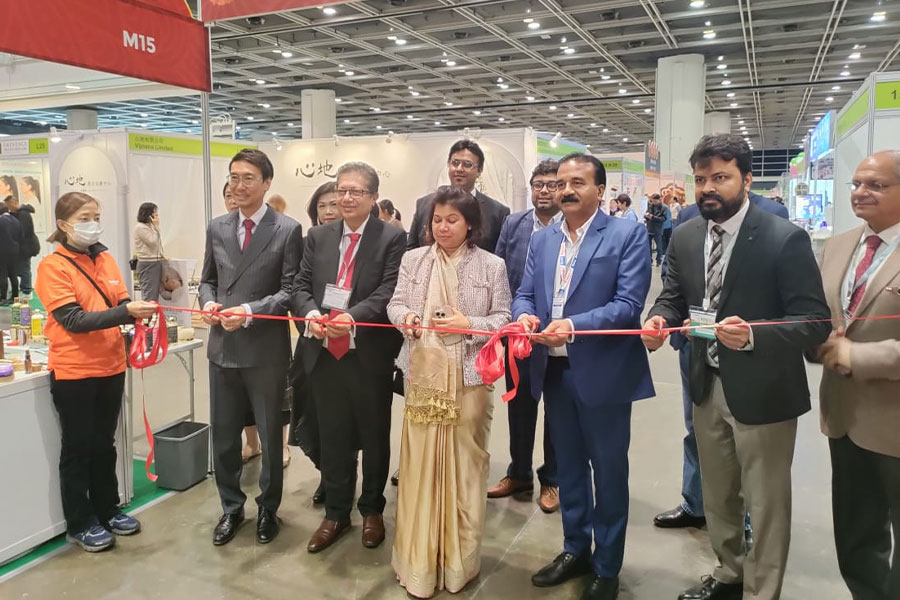
India’s relationship with Japan has grown over the years in terms of business and trade, and even beyond that to a geostrategic partnership. The two nations have been on a signing spree on bilateral agreements post-2000 – ‘Japan-India Global Partnership of 21st century’ in August 2000, ‘India-Japan Joint Declaration’ in 2001, and ‘Japan-India Partnership in the New Asian Era: Strategic Orientation of Japan-India Global Partnership’ in April 2005.
In October 2008, Japan agreed to provide India with a US$ 4.5 billion in loans for undertaking the Delhi-Mumbai Railway Project – the largest overseas project financed by Japan. In 2015 again, a bullet train line connecting Mumbai and Ahmedabad was finalised, to be built on Shinkansen technology financed by Japan with a £ 12 billion loan. Japan is the fourth largest source of FDI to India with investment of US$3.2 billion in 2019-20, and a share of 7% of total investments. India has emerged as a leading market for Japanese firms, especially in the automotive and electronics sectors.
India’s top imports from Japan (2019)
| Product code | Product label | Value in 2019 |
| 740311 | Copper, refined, in the form of cathodes and sections of cathodes | 671.11 |
| 390410 | Poly”vinyl chloride”, in primary forms, not mixed with any other substances | 431.09 |
| 290243 | P-Xylene | 294.98 |
| 847989 | Machines and mechanical appliances, n.e.s. | 261.29 |
| 890800 | Vessels and other floating structures for breaking up | 243.83 |
| 870840 | Gear boxes and parts thereof, for tractors, motor vehicles for the transport | 201.02 |
| 845710 | Machining centres for working metal | 193.57 |
| 999999 | Commodities not elsewhere specified | 173.72 |
| 710239 | Diamonds, worked, but not mounted or set (excluding industrial diamonds) | 167.84 |
| 720839 | Flat-rolled products of iron or non-alloy steel, of a width of >= 600 mm, in coils | 153.25 |
India’s top exports to Japan (2019)
| Product code | Product label | Value in 2019 |
| 710239 | Diamonds, worked, but not mounted or set (excluding industrial diamonds) | 367.09 |
| 030617 | Frozen shrimps and prawns, even smoked, whether in shell or not, incl. shrimps and prawns | 333.13 |
| 271019 | Medium oils and preparations, of petroleum or bituminous minerals, not containing biodiesel | 326.62 |
| ‘271012 | Light oils and preparations, of petroleum or bituminous minerals which >= 90% by volume “incl. … | 251.53 |
| ‘260111 | Non-agglomerated iron ores and concentrates (excluding roasted iron pyrites) | 161.03 |
| ‘760110 | Aluminium, not alloyed, unwrought | 139.46 |
| ‘720230 | Ferro-silico-manganese | 96.83 |
| ‘720241 | Ferro-chromium, containing by weight > 4% of carbon | 81.95 |
| ‘030499 | Frozen fish meat n.e.s. (excluding fillets) | 76.57 |
| ‘380893 | Herbicides, anti-sprouting products and plant-growth regulators (excluding goods of subheading … | 69.82 |
Source: ITC Trade Map; figures in US$ million at the HS 6-digit level
Impact of CEPA on bilateral trade
The Indo-Japan CEPA agreement was a mutually agreed deal signed in August 2011, to open trade in goods, services, and investments in various sectors and enhance cooperation in identified areas. It was signed considering the natural complementarities between the two nations; India’s abundant labour could help compensate for the inherent weaknesses in the Japanese economy – aging population and soaring wage rates. On the other hand, Japanese cutting edge technology could help build capacities in the Indian manufacturing sector, while India’s software skills could be useful to Japan.
Source: UN Comtrade, Figures in US$ bn
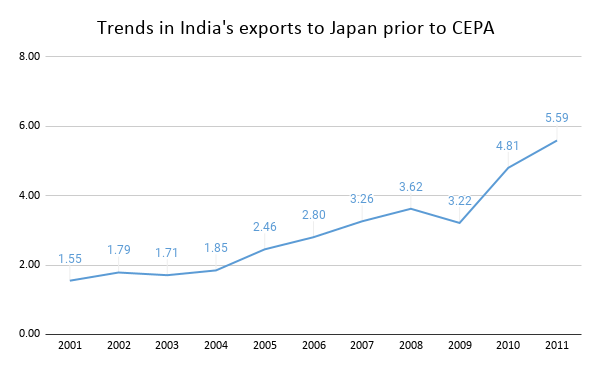
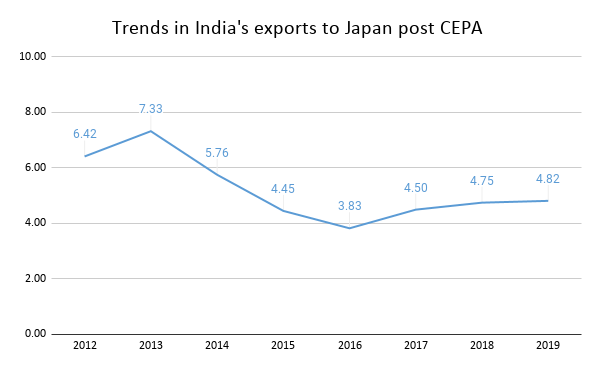
India’s exports to Japan were on the rise prior to CEPA. Even post the signing of the agreement, exports rose from US$ 5.59 billion in 2011, to a peak of US$ 7.33 billion in 2018. Trade deficit was also at a decadal low of US$ 3.2 billion.
Source:UN Comtrade, Figures in US$ bn
The past decade has witnessed a surge in total bilateral trade. India’s imports from Japan have grown thirteenfold, whereas exports have more or less stagnated since 2013. With imports from Japan at around US$ 12.7 billion, India has been one of the top markets for Japanese goods, accounting for 2.7% of Japanese exports. But India’s exports to Japan have been at only US$ 4.8 billion, constituting 0.7% of Japan’s imports from the world in 2019.
Safety standards and regulations or non-tariff measures imposed by Japan, as well as regulations increasing the cost of doing business have been identified as a major hindrance by Indian exporters, besides the language barrier. Unfortunately, India’s IT services exports have also not fared well, accounting for only 1% of the Japanese IT services market.
This observation throws light on the fact that over the years, India’s focus sectors have been unable to penetrate the Japanese market. The benefits of CEPA don’t seem to have materialized for India. Tariffs for Japan were already near zero. So the trade deal has conversely provided greater market access to Japanese exporters in India.
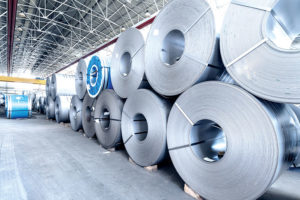
Major exported commodities of India to Japan include petroleum products, chemicals, fish and fish preparations, precious metals, precious metals, stone and jewelry, machinery, manufactured vehicles, iron and steel products, metalliferous ores, and scrap. And India mainly imports machinery, electrical machinery, iron and steel products, plastic and copper products, chemicals, etc.
Focus sector: Agriculture trade synergies between India and Japan
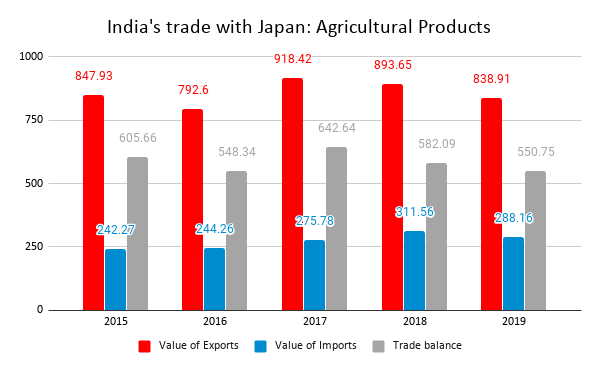
Being among the world’s largest producers and exporters of food products, India is regarded as a powerhouse in the agriculture sector. While overall exports with Japan have been declining, exports of agri products have been relatively robust.
Source: UN Comtrade, Figures in US$ bn
The sector’s share in exports and imports has almost stayed constant over the years, with a trade surplus valued at US$ 516.34 million. Top exported agricultural commodities to Japan include prawns, shrimps, fishes, cashews, oilcake, castor oil, fermented tea, vegetable extracts, mint oils, etc. Top agricultural commodities imported from Japan include rubber and articles of rubber and vegetable seeds.
Considering the top agricultural products imported by Japan and those where India has a revealed comparative advantage as well as considerable exports to the world (valued at least US$ 50 million), following are India’s agricultural products having export potential in Japan.
| Product code | Product label |
| ‘020230 | Frozen, boneless meat of bovine animals |
| ‘160521 | Shrimps and prawns, prepared or preserved, not in airtight containers (excluding smoked) |
| ‘030743 | Cuttlefish and squid, frozen, with or without shell |
| ‘030499 | Frozen fish meat n.e.s. (excluding fillets) |
| ‘100630 | Semi-milled or wholly milled rice, whether or not polished or glazed |
| ‘170114 | Raw cane sugar, in solid form, not containing added flavoring or coloring matter |
| ‘030389 | Frozen fish, n.e.s. |
| ‘130219 | Vegetable saps and extracts (excluding liquorice, hops, and opium) |
| ‘040900 | Natural honey |
Post-COVID, amidst new realities
Japan has been preparing itself to move its production sites away from China. Addressing challenges in infrastructure and logistics, relaxing ECB rules to raise capital from parent companies, can help build on India’s competitive advantages in terms of demographics, economical labour force, etc, to attract Japanese companies.
In April 2020, JETRO did a survey of Japanese companies in India and found out that only 6.9% of Japanese companies were planning to expand investments in India, as compared to 40% pre-COVID. By August, 2020, however, the ratio had altered significantly. While some of the concerns are typical of manufacturing firms, Japanese companies were also feeling constrained by circumstances unique to the initial days of the pandemic, like interstate movements of workers, and the absence of a bilateral India-Japan travel bubble.
While the Government of India has acted swiftly to adopt a series of reforms to attract FDI, there is a need for some pragmatism when it comes to Japanese FDI in particular. Pre-COVID, Japanese FDI was stagnant for both years 2018 and 2019, and latest trends indicate that the economy has got even more inward looking. Japan has announced a US$ 1.1 trillion package, at around 20% of its GDP, with the aim to reduce dependence on overseas locations and replace the China + 1 policy by a clear out-of-China policy for critical industry.
However, only US$ 2.2 billion out of this has been earmarked for relocation subsidies. In this amount, US$ 2 billion goes to high value relocation back to Japan, while US$ 200 million is for Japanese companies looking to relocate to ASEAN region. So in the medium term, India may have to be far more proactive to secure Japanese FDI, especially by examining the long-term objectives and supply chain routes of Japanese companies and looking for ways to plug into their key supply chains. Apart from this, there is a need to better leverage India’s IT skills with the industrial capabilities of Japan to benefit from the emerging digital era.


Leave a comment