
The ‘chemistry’ factor in India-France Trade
India registered total exports to France of US$ 7 billion during April-February 2022-23, growing by 26% YoY, while imports were at US$ 5.5 billion during the same period, growing by 1.63% YoY.
TPCI’s research team deep dived into the data to ascertain the products which appear most lucrative on current value, growth trends and market share. Further, we have done a more focused analysis on Organic Chemicals, which comes out as one of the most lucrative sectors in our analysis.

France is the world’s 7th largest and Europe’s 3rd largest economy after Germany and UK. With a GDP of approximately US$ 2.94 trillion in 2021 and estimated US$ 2.63 trillion in 2022. Real GDP is projected to grow by 2.6% in 2022, 0.6% in 2023 and 1.2% in 2024.
The country has abundant resources and a robust manufacturing industry. The vibrant services sector currently makes up a sizable portion of the economy and has been largely responsible for recent job growth. It is renowned for its top-notch infrastructure, including maritime ports, huge road and rail networks, and other features. The trade deficit has widened as a result of growing energy import costs, ongoing issues in the automotive and aerospace industries, and limited nuclear production capacity.
France has a stable business climate that attracts investors from around the world. The French government devotes significant resources to attracting foreign investment through policy incentives, marketing, overseas trade promotion offices, and investor support mechanisms.
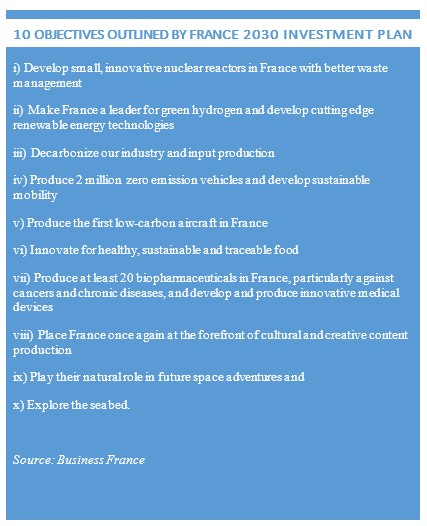
In 2021, France came up with investment plans which are to be achieved by 2030 under the name “France 2030”. It is being implemented by the French Research Agency (ANR), the French agency for Ecological Transition (ADEME) etc.
The France 2030 investment plan talks about setting out a twofold ambition: sustainably transforming key sectors of our economy (energy, automotive, aeronautics and space) through technological innovation, and positioning France not only as a player, but as a leader in the world of tomorrow. From basic research to the emergence of an idea and the creation of a new product or service, France 2030 supports the entire life cycle of innovation right up to industrialization.
India can be a major trade partner in with France and both the nations can help each other grow. The main foundations of the relationship between India and France are economic and cultural cooperation. The two nations also have historically close and friendly contacts in the fields of defence, space and civil nuclear cooperation.
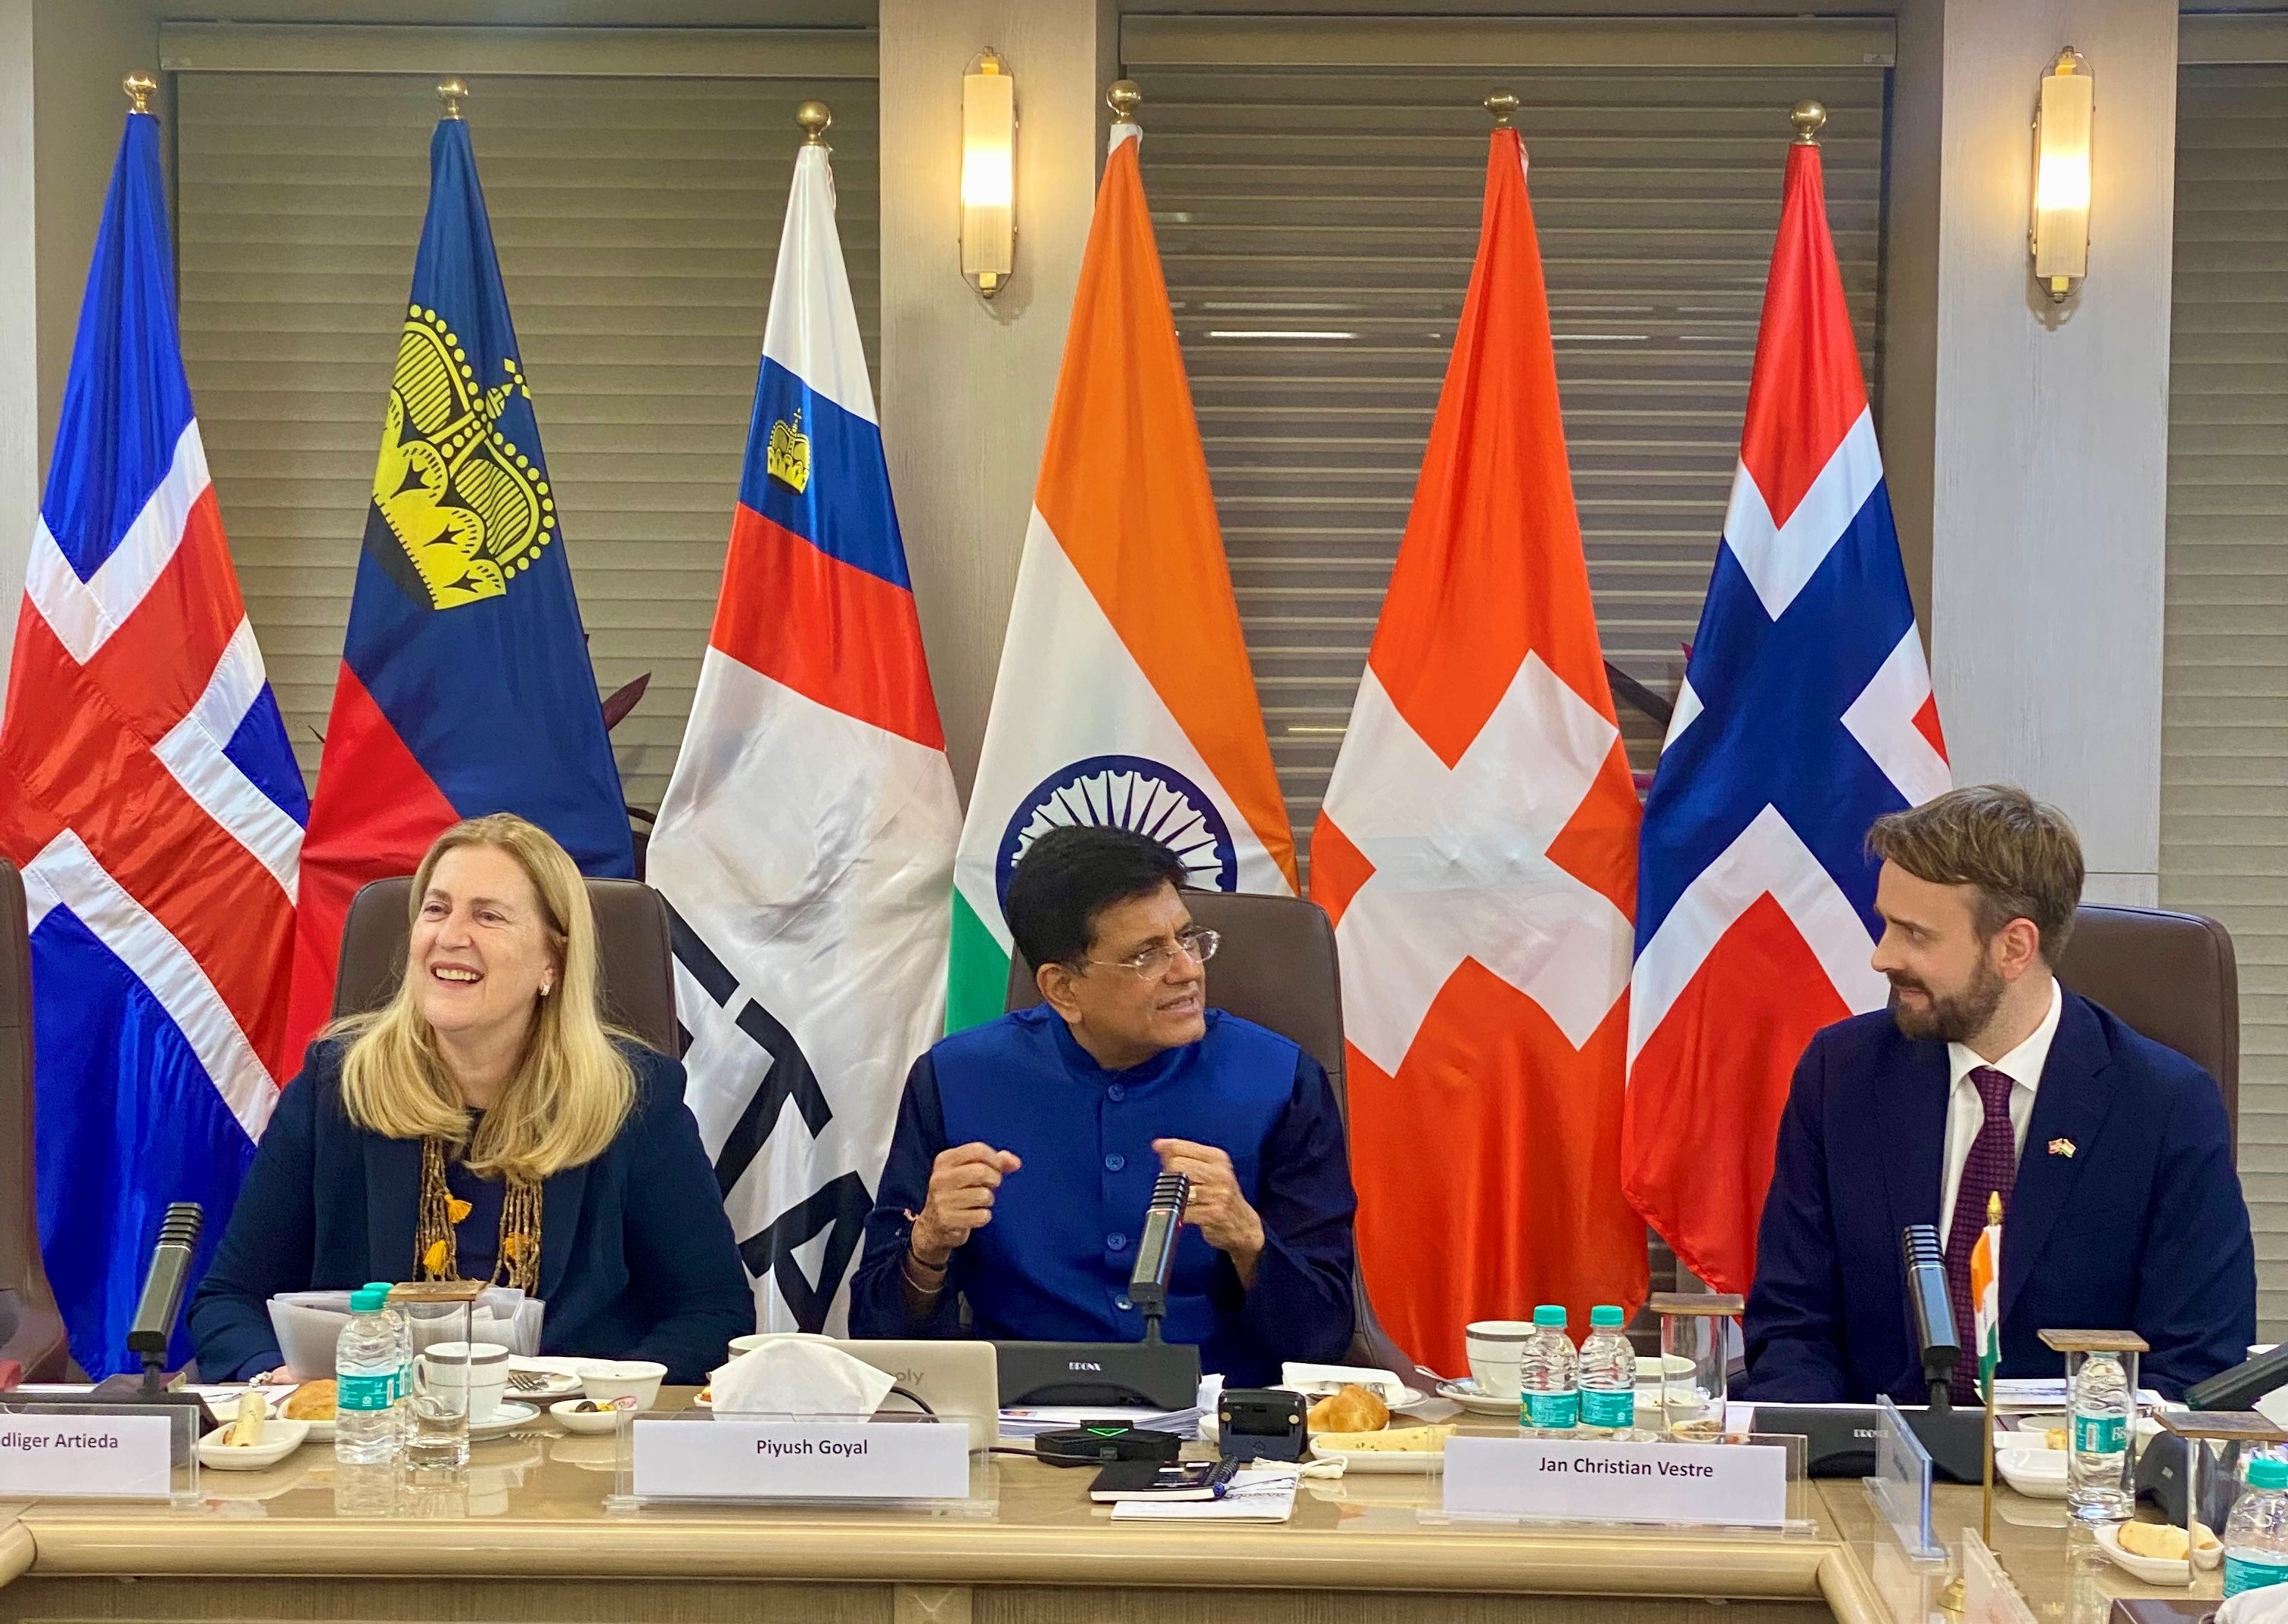
Recently Union Minister of Commerce and Industry Mr. Piyush Goyal addressed the India-France Business Summit and CEOs Round table and asked participants and delegates to invest in India. He talked about the potential in sectors such as agriculture, tourism, defense, manufacturing, pharmaceuticals, textiles and aerospace.
India-France trade relationship
India registered total exports to France of US$ 7 billion during April-February 2022-23, growing by 26% YoY, while imports were at US$ 5.5 billion during the same period, growing by 1.63% YoY.
Top commodities contributing to India’s export growth were mineral fuels (US$ 1.3 billion, up by 187.5% YoY); nuclear reactors (US$ 847.7 million, 52.37%); and natural/cultured pearls (US$ 300 million, up by 41.35% YoY). To understand India’s trade basket with France and potential products, the Committee for Advanced Trade Research (CATR) of the Trade Promotion Council of India undertook an analysis of France’s import basket and correlated it with India’s key sectors of strength.
France’s top imports in 2021
| HS Code | Product label | Value imported in 2021 (US$ Billion) | Annual growth in value between 2017-2021 (%, p.a.) |
| ‘TOTAL | All products | 704.79 | 1 |
| ’84 | Machinery, mechanical appliances, nuclear reactors, boilers; parts thereof | 84.47 | 0 |
| ’87 | Vehicles other than railway or tramway rolling stock, and parts and accessories thereof | 76.27 | 2 |
| ’27 | Mineral fuels, mineral oils and products of their distillation; bituminous substances; mineral … | 72.67 | -2 |
| ’85 | Electrical machinery and equipment and parts thereof; sound recorders and reproducers, television … | 64.43 | 2 |
| ’30 | Pharmaceutical products | 34.03 | 9 |
| ’39 | Plastics and articles thereof | 29.38 | 2 |
| ’90 | Optical, photographic, cinematographic, measuring, checking, precision, medical or surgical … | 23.35 | 4 |
| ’29 | Organic chemicals | 16.55 | 0 |
| ’72 | Iron and steel | 15.19 | 0 |
| ’73 | Articles of iron or steel | 14.42 | 4 |
Source: ITC Trade Map
France’s top imports were Machinery (US$ 84.47 billion, CAGR of 0% in 2017-21) followed by Vehicles (US$ 76.27 billion with a CAGR of 2%), Mineral fuels (US$ 72.67 billion, CAGR of -2%), Electrical machinery (US$ 64.43 billion with a CAGR of 2%) and Pharmaceutical products (US$ 34.03 billion with a CAGR 9%).
We further took the top 21 products on the basis of value and further shortlisted products where CAGR of exports was greater than 10% between 2017 and 2021. Based on this selection, we came up with the following products for further analysis.
Top HS chapters of export from India to France
| HS Code | Description | India’s exports to France in 2021 (US$ million) |
CAGR of India’s exports (2017-21 in % pa) | India’s share of France’s imports(%) | India’s rank as exporting country | CAGR of France’s total imports (2017-21) | Top 3 exporters to France (with market share) |
| 29 | Organic chemicals | 313.52 | 13 | 1.89 | 9 | 0 | Germany (17.5%); Belgium (15.7%); US (11%) |
| 30 | Pharmaceutical products | 390.35 | 24 | 1.15 | 22 | 9 | Germany (14.3%); US (11.9%); Ireland (10.9%) |
| 40 | Rubber and articles thereof | 133.43 | 12 | 1.62 | 16 | 1 | Germany (16.2%); Spain (9.6%); China (7.8%) |
| 57 | Carpets and other textile floor coverings | 58.9 | 12 | 9.98 | 4 | 2 | Belgium (17.2%); China (16.7%); Netherlands (13%) |
| 72 | Iron & Steel | 57.4 | 37 | 0.38 | 13 | 0 | Belgium (25.9%); Germany (21.1%); Spain (12.8%) |
| 85 | Electrical machinery and equipment and parts thereof; sound recorders and reproducers, television… | 551.88 | 19 | 0.86 | 26 | 2 | China (29.7%); Germany (9.8%); Italy (4.6%) |
| 94 | Furniture; bedding, mattresses, mattress supports, cushions and similar stuffed furnishings… | 158.79 | 11 | 1.12 | 12 | 4 | China (29.5%); Italy (13%); Germany (10.8%) |
Source: ITC Trade Map
A preliminary analysis of the above data shows that for these products, Germany is the topmost exporter for 3 HS codes, followed by Belgium and China at two each. Therefore, five of the top source markets are within the EU itself. Out of these products, India’s growth rate is fastest for Iron & Steel (HS ’72, 37%); Pharmaceutical Products (HS 30, 24%); Electrical machinery… (HS 85, 19%) and Organic chemicals ( HS 29, 13%). Notably, India’s growth rate is faster than the growth rate of France’s imports for all these HS codes, showing that it is in a position to gain market share.
When it comes to rank, however, India’s position is most favourable in Carpets and other textile floor coverings… (HS 57, rank 4), followed by Organic Chemicals (HS 29, rank 9); Furniture & Bedding (HS 94, rank 12); Iron & Steel (HS 72; rank 13) and Rubber & articles thereof (HS 40, rank 16). When you compare with those HS codes where India is ranked among the top 10 globally (considered as a parameter for competitiveness), Carpets & other textile floor coverings (global rank 3); Organic Chemicals (rank 9) and Iron & Steel (rank 7) come up.
Therefore, these are categories where India should definitely be focusing on to increase market share. Given that Organic Chemicals is ranked higher among France’s total imports, we proceed with a deeper dive into organic chemicals to understand how India fares in France’s import basket for this HS code.
Focus product: Organic Chemicals
France’s imports of Organic Chemicals from the world for recorded at US$ 16.56 billion in 2021, which have remained flat on an average between 2017 and 2021. India has a share of 1.89% in France’s imports of this chapter. It has 3.1% share in world imports with a ranking of 9. France’s trade deficit in this chapter was at around US$ 2.9 billion in 2021.
|
Top imports by France under Organic Chemicals chapter at 4 digits |
|||||||
| HS Code | Product label | Value imported in 2021 (USD thousand) | Annual growth in value between 2017-2021 (%, p.a.) | India’s exports to France in 2021 | Annual growth in value between 2017-2021 (%, p.a.) | Share in France’s imports and rank | Top exporting countries |
| ‘2933 | Heterocyclic compounds with nitrogen hetero-atom[s] only | 2264.691 | 6 | 108.68 | 14% | 4.79%, #7 | China (21.3%); US (19.6%); Germany (15%) |
| ‘2937 | “Hormones, prostaglandins, thromboxanes and leukotrienes, natural or reproduced by synthesis; … | 1773.642 | -11 | 3.54 | -1% | 0.19%, #18 | Belgium (52.4%); US (17.5%); Australia (9.8%) |
| ‘2901 | Acyclic hydrocarbons | 1098.269 | -6 | 1.02 | 233% | 0.09%, #21 | Germany (27.9%); Italy (17.8%); Belgium (14.3%) |
| ‘2902 | Cyclic hydrocarbons | 999.14 | -4 | 7.09 | 3% | 0.7%, #14 | Netherlands (32.5%); Germany (24.8%); Belgium (14.6%) |
| ‘2905 | Acyclic alcohols and their halogenated, sulphonated, nitrated or nitrosated derivatives | 904.232 | 1 | 12.1 | 16% | 1.33%, #13 | Germany (30.6%); Belgium (14.8%); Netherlands (13.2%) |
| ‘2934 | Nucleic acids and their salts, whether or not chemically defined; heterocyclic compounds (excluding … | 864.822 | 10 | 62.6 | 45% | 7.23%, #6 | Ireland (17.8%); Germany (15.6%); China (9.8%) |
| ‘2915 | Saturated acyclic monocarboxylic acids and their anhydrides, halides, peroxides and peroxyacids; … | 665.054 | 13 | 9.8 | 6% | 1.47%, #14 | Belgium (25%); Germany (20.1%); Netherlands (9%) |
| ‘2935 | Sulphonamides | 658.035 | -10 | 19.81 | 57% | 3.01%, #7 | Ireland (55.2%); US (18.5%); Area nes (5.2%) |
| ‘2909 | Ethers, ether-alcohols, ether-phenols, ether-alcohol-phenols, alcohol peroxides, ether peroxide, … | 588.664 | 4 | 4.12 | -1% | 0.69%, #9 | Netherlands (64.5%); Germany (12.2%); Belgium (8.4%) |
| ‘2941 | Antibiotics | 572.998 | -8 | 57.51 | 63% | 10.03%, #3 | US (52.8%); China (17.8%); India (10%) |
India is a strong player in Organic Chemicals exports with a global rank of 9 and export value of US$ 21.2 billion in 2021. It has a share of 4.4% in world exports of the chapter and a 9% annual value growth during 2017-21. However, India is also a major importer in the chapter, with imports of US$ 27.23 billion and negative trade balance of US$ 6.1 billion. China is the top exporter to India with a share of 15.3%, followed by the UAE at 7.6% and the US at 7.3%.
Now let us look at how France’s trade basket looks like at the 4-digit level in Organic Chemicals, and compare it to India’s exports.
|
India’s exports of selected Organic Chemical products |
|||||||
| Code | Product label | Value exported in 2021 (USD thousand) | Annual growth in value between 2017-2021 (%, p.a.) | Annual growth in value between 2020-2021 (%, p.a.) | Annual growth of world imports between 2017-2021 (%, p.a.) | Share in world exports (%) | Ranking in world exports |
| ‘2902 | Cyclic hydrocarbons | 4129616 | 8 | 48 | -5 | 9.2 | 2 |
| ‘2933 | Heterocyclic compounds with nitrogen hetero-atom[s] only | 3594440 | 13 | 19 | 6 | 4.5 | 7 |
| ‘2915 | Saturated acyclic monocarboxylic acids and their anhydrides, halides, peroxides and peroxyacids; … | 853033 | 9 | 37 | 9 | 4.2 | 9 |
| ‘2941 | Antibiotics | 780345 | -1 | -14 | -2 | 8.3 | 3 |
| ‘2934 | Nucleic acids and their salts, whether or not chemically defined; heterocyclic compounds (excluding … | 752225 | 12 | 11 | 20 | 2.9 | 8 |
| ‘2909 | Ethers, ether-alcohols, ether-phenols, ether-alcohol-phenols, alcohol peroxides, ether peroxide, … | 628866 | 15 | 24 | -1 | 3.6 | 8 |
| ‘2901 | Acyclic hydrocarbons | 502313 | 7 | 140 | -2 | 1.9 | 13 |
| ‘2905 | Acyclic alcohols and their halogenated, sulphonated, nitrated or nitrosated derivatives | 422179 | 5 | 1 | 0 | 1.1 | 21 |
| ‘2935 | Sulphonamides | 295510 | 15 | 13 | -1 | 3 | 7 |
| ‘2937 | “Hormones, prostaglandins, thromboxanes and leukotrienes, natural or reproduced by synthesis; … | 254421 | 9 | 3 | 8 | 1.2 | 11 |
A look at the data shows India has the highest rank in HS ‘2941 (Antibiotics, #3); followed by HS ‘2934 (Nucleic acids…, 6); HS ‘2935 (Sulphonamides, #7); HS ‘2933 (Heterocyclic compounds with nitrogen atoms…, #7) and HS ‘2909 (Ethers, ether alcohols…, #9). On the other hand, India is showing strong export growth trends in HS ‘2901 (Acyclic hydrocarbons, 233%); HS ‘2941 (Antibiotics, 63%); HS ‘2935 (Sulphonamides, 57%); HS ‘2934 (Nucleic acids…, 45%) and HS ‘2905 (Acyclic alcohols…, 16%).
Now at the next level, when we see India’s global competitiveness, the country is ranked amongst the top 10 globally in most of these HS codes, particularly ‘2902 (Cyclic hydrocarbons, #2); ‘2933 (Heterocyclic compounds…, #7); ‘2915 (Saturated acyclic monocarboxylic acids…, #9); ‘2941 (Antibiotics, #3); ‘2934 (Nucleic acids and their salts…, #8); ‘2909 (Ethers, ether-alcohols, ether-phenols… #8); and ‘2935 (Sulphonamides, #7). Therefore, further potential and specific market access issues can be explored and addressed for these products (especially going upto 8-digit level to understand actual product-market-competitor mapping), due to positive indicators on market share, growth, India’s overall strengths and competitiveness as an exporter.


Thanks for this piece, it’s really informative to knowing about the trade between Indian and France, also gives an idea scope of the gaps where Indian can focus to improve the trade