
Re-imagining India’s trade with the non-ASEAN RCEP
India’s decision to exclude itself from RCEP, at least for now, is aimed at protecting itself from a potential surge in imports, especially China. Nevertheless, it is also true that India cannot pull back on its business association with RCEP countries, as they are integral to the future of global trade, value chains, and investment.
Viewing it from a sum-of-parts approach, RCEP started with the ASEAN region, where India is already engaged through an FTA (currently under review). This IBT Infographic blog presents a comprehensive overview of India’s trade dynamics with non-ASEAN RCEP countries viz. China, Japan, Australia, New Zealand, and the Republic of Korea. It further analyses which countries look most suitable for deeper economic ties, considering trade complementarity and latent potential.

Source: https://bit.ly/3ggiBVo
1. Trade deficit
India’s trade with the world has expanded at a brisk pace over the last decade. Out of the five countries in our consideration set, four (China, South Korea, Japan, and Australia) have been among India’s top 20 trading partners in 2019. However, India has been a net importer with all these countries, as evident in the following table:
India’s trade balance with non-ASEAN RCEP countries
Year |
China |
Japan |
Republic of Korea |
Australia |
New Zealand |
| 2015 | -52,102 | -5,175 | -9,482 | -6,152 | -236 |
| 2016 | -51,565 | -5,981 |
-8,748 | -5,781 | -200 |
| 2017 | -59,390 | -5,965 | -11,706 | -10,469 | -282 |
| 2018 | -57,342 | -7,827 | -11,624 | -10,384 | -255 |
| 2019 | -51,204 | -7,702 | -11,445 | -7,677 | -172 |
Source: UN Comtrade; Figures in US$ million
Over the years, India’s trade deficit has been on the rise, except in 2018-19. This was attributed, in part, due to an increase in exports and a reduction in imports from these countries, coupled with the onset of the US-China trade war that acted in India’s favour. Among these non-ASEAN RCEP partners, the deficit is least with New Zealand, but that is also due to the low trade volume, followed by Australia and Japan.
2. Pattern of trade
We proceed to analyse what Indian product categories are finding space in these non-ASEAN RCEP countries, as is depicted in the following graph:
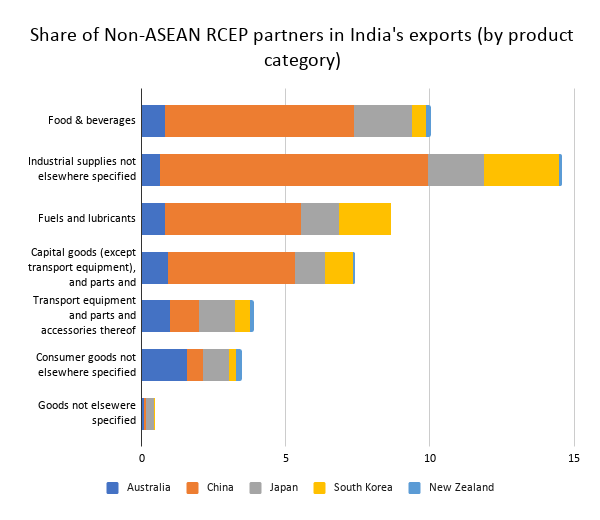
Source: WITS; percentage share of non-ASEAN RCEP countries in India’s total exports
Industrial supplies – the largest segment in India’s export basket with a 36.4% share, is competitive in these countries as well. Around 9.3% share goes to China alone, followed by South Korea (2.6%) and Japan (1.96%).
Indian consumer goods – the second largest segment constituting 20% of India’s exports – is in huge demand in Australia. Even though Australia has a relatively lower share in India’s exports (<1%) in all other categories, it accounts for 1.56% share in India’s consumer goods exports. This is possibly also due to the presence of a huge Indian diaspora in the country.
F&B is a smaller segment comprising 9.2% of India’s export basket. Yet, it is the second best performer in these countries taken together. China (6.58%) is a leading market for India’s F&B, followed by Japan (2%) and Australia (0.8%). Digging deeper into the F&B segment, a trade surplus with all five countries is clear from the table given below, surprisingly led by China.
The data shows that these five countries account for a substantial share of India’s exports of industrial supplies and F&B products, while the share in consumer goods and transport equipment exports is relatively lower (<5%)
| India’s trade balance in F&B category in 2019 | |
| China | 2,121.27 |
| Japan | 621.59 |
| Korea Rep. of | 186.4 |
| Australia | 115.61 |
| New Zealand | 15.16 |
Source: ITC Trade Map; figures in US$ million
3. FDI inflows
Moving from goods, let’s look at the investment patterns. Japan is the largest source of FDI in India from April 2000 to September 2020, having about 6.83% share in inflows, South Korea comes a distant second with 0.93% share of the value of inflows. India has also been eyeing investments from Japanese firms not present in India like Nintendo, Hitachi Metals, Taisho Pharma, Mizuno, and Ono pharma. The relationship might get even stronger with Japan incentivising its firms to move bases out of China to India and Bangladesh or back home.
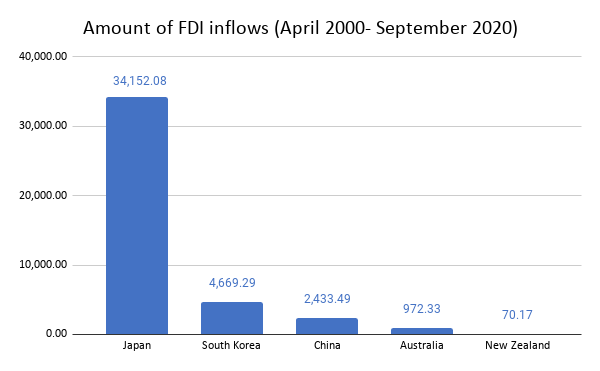
Source: DPIIT, Figures in US$ million
4. Trade intensity
The fact that there is untapped trade potential with these countries becomes clear from the Trade Intensity Index with India. The index reveals whether the value of trade between two countries is greater or smaller than what is expected, considering the partner’s importance in global trade. CATR’s calculations show that all the values are below 1, indicating that bilateral trade is less than the potential level.
| Country | Trade intensity index |
| China | 0.48 |
| Japan | 0.41 |
| Korea, Republic of | 0.49 |
| Australia | 0.61 |
| New Zealand |
0.58 |
CATR Analysis; index<1 shows trade is below potential level
5. Trade Complementarity index:
Having seen that there is an untapped trade potential with all these countries, it is imperative to look at the countries where we have a better match as partners. Our analysis of the trade complementarity index shows the greatest synergy with New Zealand, followed by Australia and Japan as depicted in the figure below:
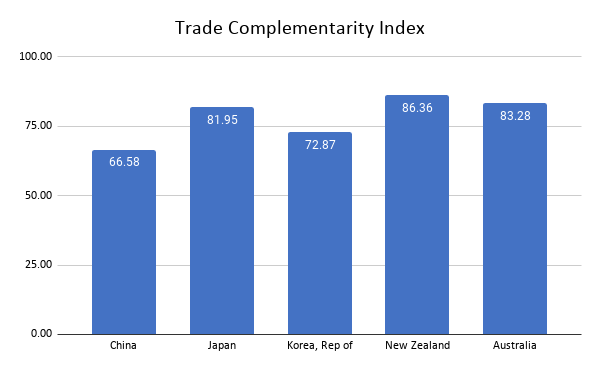
Source: WITS, CATR research
Complementarities with New Zealand are interesting and indicate that there are so many intermediate, consumption, and capital good products that can find space in their market. Further, India’s share in New Zealand’s market is merely 1.1%. However, the size of New Zealand’s economy limits potential gains.
Australia might be entering RCEP with China, but its trade tensions with Beijing are simultaneously pushing it to reduce reliance on the latter and intensify its engagements with India. Further, India acts as a major market for Australian services, and an major source to Australia’s education sector. So the higher complementarities are the icing on the cake for this blossoming relationship.
The same goes for Japan, which is not far behind on trade complementarity, and is the largest source of FDI into India. Our analysis shows that going forward, it makes sense for India to look for enhanced engagement with these countries even as it chooses to stay outside the larger RCEP framework.


brilliant article