
India’s post-COVID trade blueprint from a G-20 framework
As India looks to re-negotiate and enter into new trade agreements with partners in the post-COVID scenario, the G-20 naturally takes precedence, as it accounts for over 70% of global trade. A preliminary analysis confirms that India’s exports to the developed countries within the G-20 (G-7) have improved post 2014.
Coupled with the higher trade complementarity with these countries, it seems prudent for India to prioritise trade negotiations with the G-7.
With the signing of the RCEP agreement last week sans India and murmurs of a possible return of the US to TPP under Donald Trump, mega-regional trade deals are suddenly in the limelight once again. India has taken a clear stance, wherein it will enter trade agreements which are balanced and where it stands to gain.
As a country grouping, the G-20 will definitely not count as a possible candidate by any stretch of the imagination, considering that constituent countries have so little that’s ‘collectively common’. But at the same time, one cannot ignore the fact that the G-20 constitutes 75% of global trade, 85% of the world economy, and two-thirds of the global population. So it seems quite apt to put the G-20 into context as India looks to enhance its presence in global trade, especially post-pandemic.
The G-20 can be separated into two groups of developed and developing economies. The developed economies comprise the former group of seven – the G-7 – and the rest comprise 13 large developing economies including India. The classification and share in global trade are shown in the following table:
| Developed G-20 (or G-7) | Share in world imports in 2019 | Developing G-20 | Share in world imports in 2019 |
| US | 13.5 | EU excluding Germany, Italy & France | 18.2 |
| Germany | 6.5 | China | 10.9 |
| Japan | 3.8 | South Korea | 2.6 |
| UK | 3.6 | India | 2.5 |
| France | 3.3 | Mexico | 2.5 |
| Italy | 2.5 | Russia | 1.3 |
| Canada | 2.4 | Australia | 1.1 |
| Turkey | 1.1 | ||
| Brazil | 0.9 | ||
| Indonesia | 0.9 | ||
| Saudi Arabia | 0.8 | ||
| South Africa | 0.5 | ||
| Argentina | 0.3 |
Source: UN Comtrade, figures in %
The trend of India’s exports to G-20 members
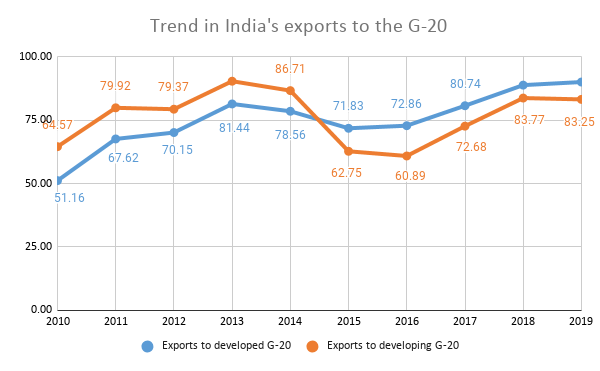
Source: UN Comtrade, figures in US$ billion
India’s exports to the remaining G-19 nations have followed an interesting pattern. Prior to 2014, exports going to developing G-20 nations exceeded those headed for G-7 countries, but the order has flipped subsequently. And after 2015, exports to G-7 have not only risen at a rapid pace, but have also exceeded exports to developing G-20 countries.
Seen in the light of the changing Indian trade basket – a shift from traditional sectors like agricultural commodities and textiles to modern sectors like pharmaceutical, engineering goods, and BPO services – can be a potent factor. Engineering goods share has significantly increased over the last decade from 12% to 28%. India has also emerged as a pharmacy to the world with demand for Indian drugs expanding rapidly. This is clear from India’s emergence as a leading provider of generic drugs, catering to over 50% of the global vaccine demand, 40% of the generic drugs demand in the US and 25% of demand for medicines in the UK. Further, it could also be depicting India’s increased diversification not only in the exports of products but also in terms of export destinations.
Another highlight is that G-7’s imports from India have continuously been rising after 2014. Even when imports from the world declined, particularly from 2018 to 2019 by as much as 2.3%, its imports from India increased by 2.7%. The US-China trade war is a key factor that drove the US and other allies to countries like Vietnam and India to compensate for its 16% decline in imports from China. This could exacerbate post-COVID, as the world looks to pivot further away from the Chinese ecosystem.
India’s pattern of trade with other members of G-20
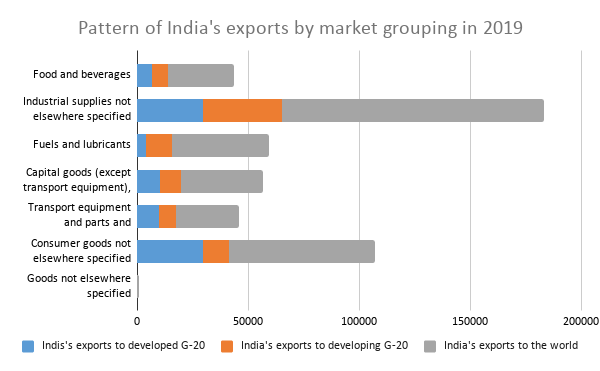
Source: UN Comtrade, figures in US$ million
India exported much less than 50% of its global exports in the categories of food and beverages, industrial supplies, fuels and lubricants, capital goods, transport equipment, consumer goods, etc. to the G-19 in 2019. While industrial supplies, capital goods, and transport equipment were found to be equally relevant in the G-7 and G-12, India’s consumer goods exports were much higher to the developed G-20 in comparison to the developing G-20. On the other hand, fuels & lubricants and food & beverages managed higher penetration in the developing G-20.
Further, there is even higher potential in the developed G-20 as compared to developing G-20 nations. This is evident from the trade complementarity index between India and the developed & developing G-20. In the case of developed nations – the index value of 91.4 shows immense potential for a favorable trade arrangement in exports of capital, intermediate and consumer goods. In the developing group too, there are complementarities, even though slightly less with an index value of 85.8.
India’s top exports to G-20 countries
|
Top imports from India by the developed G-20 (G-7) in 2019 |
||
| HS Code | Product name | Value of Imports in US$ million |
| 710239 | Diamonds, worked, but not mounted or set (excluding industrial diamonds) | 9,024.917 |
| 300490 | Medicaments consisting of mixed or unmixed products for therapeutic or prophylactic purposes | 7,733.68 |
| 271019 | Medium oils and preparations, of petroleum or bituminous minerals, not containing biodiesel | 4,400.019 |
| 271012 | Light oils and preparations, of petroleum or bituminous minerals which >= 90% by volume | 2,975.28 |
| 030617 | Frozen shrimps and prawns, even smoked, whether in shell or not, incl. shrimps and prawns in . . . | 2,892.762 |
| 711319 | Articles of jewellery and parts thereof, of precious metal other than silver, whether or not | 2,187.884 |
| 999999 | Commodities not elsewhere specified | 1,325.138 |
| 610910 | T-shirts, singlets and other vests of cotton, knitted or crocheted | 966.74 |
| 630260 | Toilet linen and kitchen linen, of terry towelling or similar terry fabrics of cotton (excluding | 962.964 |
| 630231 | Bedlinen of cotton (excluding printed, knitted or crocheted) | 918.226 |
|
Top imports from India by the developing G-20 in 2019 |
||
| HS Code | Product name | Value of Imports in US$ million |
| 271019 | Medium oils and preparations, of petroleum or bituminous minerals, not containing biodiesel | 5,823 |
| 710239 | Diamonds, worked, but not mounted or set (excluding industrial diamonds) | 3,443 |
| 300490 | Medicaments consisting of mixed or unmixed products for therapeutic or prophylactic purposes | 2,382 |
| 870322 | Motor cars and other motor vehicles principally designed for the transport of persons, incl. | 1,832 |
| 999999 | Commodities not elsewhere specified | 1,659 |
| 290243 | P-Xylene | 1,413 |
| 271012 | Light oils and preparations, of petroleum or bituminous minerals which >= 90% by volume “incl. | 1,383 |
| 711319 | Articles of jewellery and parts thereof, of precious metal other than silver | 1,325 |
| 100630 | Semi-milled or wholly milled rice, whether or not polished or glazed | 1,296 |
| 030617 | Frozen shrimps and prawns, even smoked, whether in shell or not, incl. shrimps and prawns | 1,291 |
Source: UN Comtrade; at the HS six-digit level
Diamonds, medicaments, and medium oils are top imports by both groups, making Indian gems and jewelry sectors and pharmaceutical sectors the major winners. The gems and jewelry sector finds major market space in the US, which is responsible for 40% of the global demand and its exports especially grew in 2018 to 2019, attributed majorly to the US-China trade war which brought in an estimated US$ 1 billion in opportunities to India.
India’s trade performance in G-7 among its peers
As compared to other South Asian and Southeast Asian countries, the share of G-7 in India’s export basket is 27.9%. India’s performance is behind Vietnam, Bangladesh, the Philippines, Cambodia, and China, and only slightly weaker than Thailand.
A lower share of G-7 in India’s trade basket, coupled with high complementarity of trade with the group again strengthens the case for immense potential for India to grow trade with the G-7.
| Country | Share of G-7 in the country’s exports |
| India | 27.9% |
| Vietnam | 39.8% |
| Bangladesh | 53.8% |
| Thailand | 28.3% |
| Malaysia | 21.4% |
| Indonesia | 24.5% |
| Philippines | 38.3% |
| Singapore | 17.6% |
| Cambodia | 61.7% |
| Myanmar | 21.6% |
| China | 32.3% |
Source: UN Comtrade; figures for 2019
The US is the main driver of India’s trade in this country group which is clear from the 16.8% of India’s exports that went to the US alone and brought in a surplus worth US$ 19.5 billion in 2019.
The future road for India in the G-20
How does India fare in the trade with the G-20, gains importance due to several reasons. First, post covid-19, the future of the trade arrangements is uncertain as countries turn inward following ‘Me-first’ policies. Even if this possibility is discarded, developed countries like the USA are in search of alternatives to China to relocate their production bases out of China, and India is simultaneously working on creating a favorable environment for businesses and investments.
Second, India does not have a trade agreement with the developed world, barring those with Japan and South Korea, and analysis has confirmed issues it faces with present trade agreements. India needs to look at potential win-win trade agreements with G-7 countries as a priority, where it can look to extract greater market access, FDI, technology transfer and collaborations, while addressing issues like tariffs, SPS/TBT barriers, mobility of professionals, etc that come in the way of more effective economic integration with these countries. The specifics of such arrangements are a subject of much deeper analysis.


Leave a comment