
India-UAE CEPA in retrospect, one year later
The India-UAE CEPA, a comprehensive agreement that addresses every facet of India’s economic relations with the UAE, including trade, investments, healthcare, digital trade, government procurement, intellectual property rights, etc, completed one year on May 1, 2023. IBT looks at key highlights and trends in trade and investment relations between the two countries during this period, which seem to indicate the beginning of a new and positive paradigm.
- India’s total exports to UAE were recorded at US$ 31.3 billion during FY 2022-23, growing by 11.8% YoY.
- Bilateral trade has reached its all-time high of approximately US$ 84.5 billion (FY 2022-23), registering a YoY growth of 16%.
- After the India-UAE CEPA, approximately 54,000 COOs were issued from May 22 – March 23.
- The India-UAE (CEPA) has surpassed almost all other FTAs in utilization.
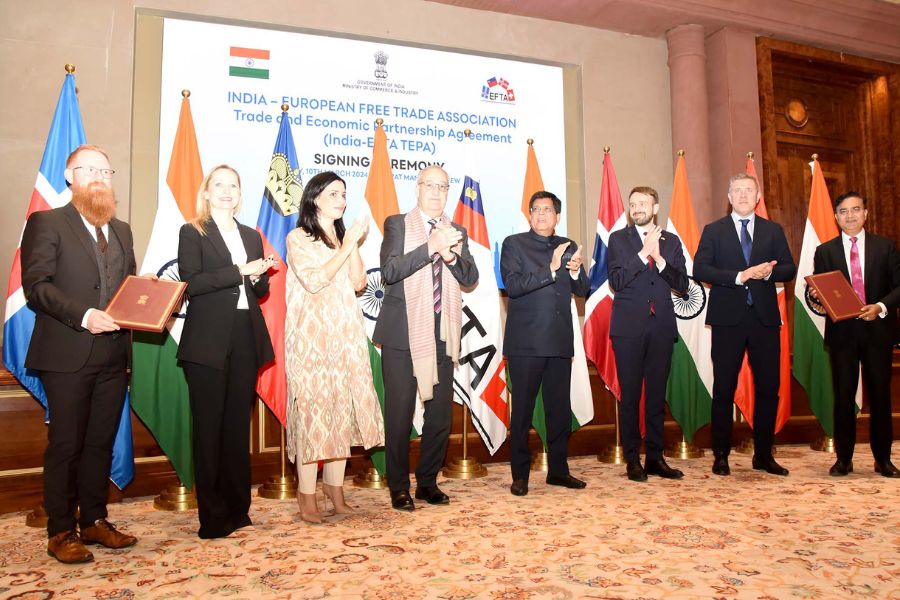
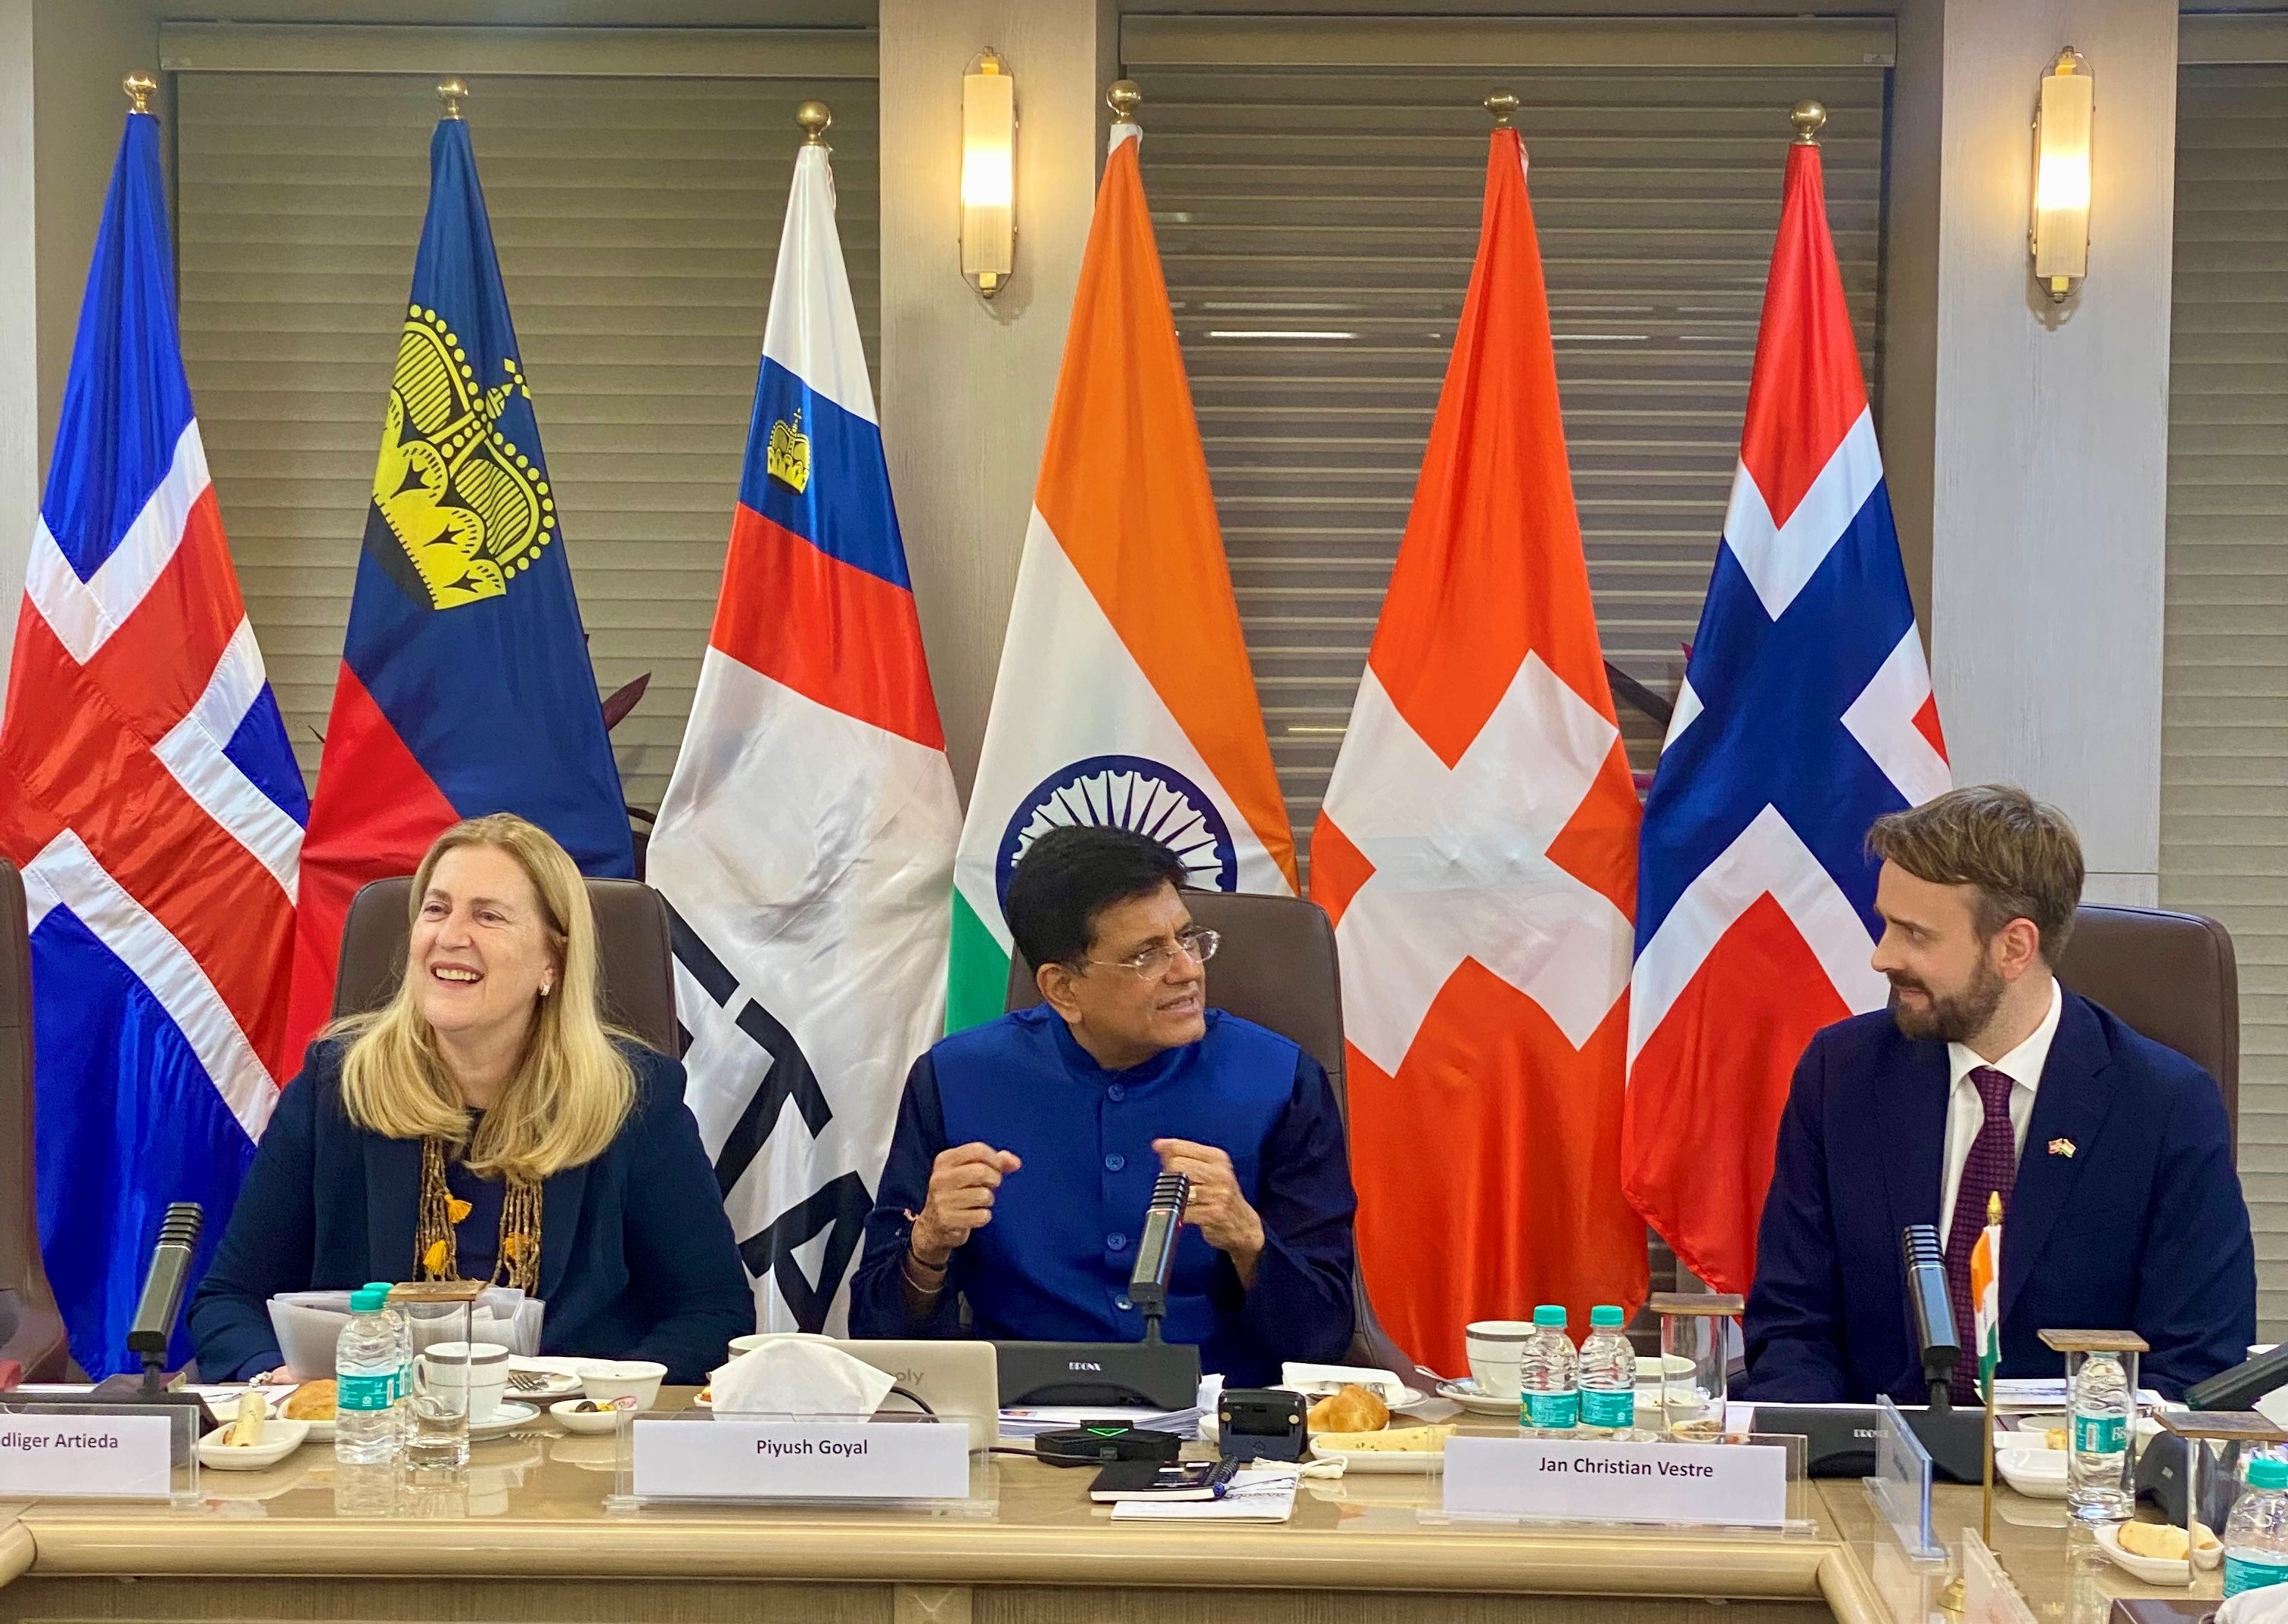
India has signed around 13 free trade agreements (FTAs) so far including FTAs with ASEAN, Japan, Mauritius, Australia and the UAE. To examine the impacts of these FTAs and their changing architectures, EY conducted a discussion with industry leaders and policymakers. Panelists noted that there has been a shift in architecture between earlier FTAs and the latest ones with India currently standing in a stronger position.
Previous FTAs have yielded varied results for India, with the outcomes of the agreements with Japan, Korea, and ASEAN being relatively balanced overall. However, in the case of ASEAN, India experienced limited export growth while witnessing a sharp increase in imports, which was a critical concern for policy makers during RCEP negotiations as well.
On the other hand, recent FTAs with the UAE and Australia have presented some very interesting opportunities for Indian industries. Notably, India and the UAE have been trading partners for many years. On analyzing bilateral trade data for the past 2 decades, value has increased at a CAGR of 16.5% between 2002-03 and 2022-23. The India-UAE CEPA was expected to increase the total value of bilateral trade in goods to over US$ 100 billion and trade in services to over US$ 15 billion within five years. After a year of the agreement, India and UAE’s trade has shown fruitful results.
All time high in trade
Bilateral trade has reached its all-time high of approximately US$ 84.5 billion (Apr 2022-Mar 23), registering a YoY growth of 16%. During the CEPA implementation period (from May 22 to Mar 23), bilateral trade increased from US$ 67.5 billion (May 21-Mar 2022) to US$ 76.9 billion (May 22-Mar 2023), registering an annual increase of 14%. India exported goods worth US$ 31.3 billion to the UAE during FY 22-23 with a YoY growth of 11.8%. On the other hand, imports from the UAE grew by 18.8% YoY to reach a value of US$ 53.2 billion.
The India-UAE CEPA eliminates 80% tariffs on Indian and Emirati goods and all the tariffs will be eliminated within 10 years. The pact between the nations gives the UAE zero-duty access to 90% of India’s exports to the country. After the agreement, approximately 54,000 COOs were issued from May 22 – March 23 depicting the CEPA has surpassed almost all other FTAs in utilization.
Overall, India benefits from preferential market access provided by the UAE on over 97 % of its tariff lines, which account for 99% of Indian exports to the UAE in value terms, particularly from labour-intensive sectors. These sectors include Gems and Jewelry, Textiles, leather, footwear, sports goods, plastics, furniture, agricultural and wood products, engineering products, pharmaceuticals, medical devices, and Automobiles. Indian service providers have enhanced access to around 111 sub-sectors from the 11 broad service sectors.
India’s Top Export Gainers from the CEPA at 2 Digit Level
| Chapter | Chapter Description | Apr 22 –March 23 (US$ Million) | Absolute Change (US$ Million YoY) | % Change (YoY) |
| 33 | Essential oils and resinoids; perfumery, cosmetic or toilet preparations | 412.28 | 200 | 94% |
| 87 | Automobiles | 715.58 | 211.31 | 42% |
| 27 | Mineral Fuels, Mineral Oils & products of their distillation | 8414.11 | 2218.18 | 36% |
| 10 | Cereals | 655.19 | 168.64 | 35% |
| 85 | Electrical machinery and equipment | 3649.03 | 892.28 | 32% |
| 38 | Miscellaneous chemical products | 210.24 | 49.81 | 31% |
| 07 | Edible vegetables and certain roots and tubers | 267.39 | 62.45 | 30% |
| 09 | Coffee, tea, mate and spices | 375.9 | 80.9 | 27% |
| 84 | Machinery & mechanical Appliances | 1072.22 | 171.01 | 19% |
| 71 | Gems & Jewellery | 5772.34 | 819.96 | 17% |
| 73 | Articles of iron or steel | 466.48 | 50.02 | 12% |
Source: Ministry of Commerce and Industry
According to data in the table, 11 products have seen an upward growth in exports to the UAE. Essential oils and resinoids; perfumery, cosmetic or toilet preparations have registered the highest YoY growth of 94% for FY 2022-23, followed by automobiles (up by 42%); mineral fuels and mineral oils (up by 36%); cereals (up by 35% YoY) and electrical machinery and equipment (up by 32% YoY).
Exports with Negative Growth
| Chapter | Chapter Description | Apr 22-March 23 | Absolute Change (US$ million YoY) | % Change (YoY) |
| 72* | Iron and steel | 1050.16 | -600.2 | -36% |
| 62 | Articles of apparel and clothing accessories, not knitted or crocheted | 530.88 | -381.75 | -42% |
| 61 | Articles of apparel and clothing accessories knitted or crocheted | 697.18 | -214.46 | -24% |
Source: Ministry of Commerce and Industry
* Export duty of 15% on finished steel during the majority of this period.
Articles of apparel and clothing not knitted or crocheted have recorded a negative growth of 42%, followed by Iron and steel articles with a negative growth of 36%, and articles of apparel and clothing knitted or crocheted with a negative growth of 24%.
India-UAE Granular Level Data (4-Digit)
Some sectors have seen significant growth because of the CEPA including Mineral fuels; Electrical Machinery (particularly telephone equipment), Gems and Jewelry, Automobiles (Transport vehicles), Beauty and skin care products (essential oils, perfumes, and cosmetics), Other machinery, cereals (Rice), Coffee/Tea/Spices, other Agriproducts as well as Chemicals products.
Indian exports to the UAE (4-digit level)
| HS Code | Chapter Description | Apr 22 –March 23 | Absolute Change | % Change |
| 7225 | Flt-rolld prdcts of othr alloy stl of wdth 600 mm or more | 182.79 | 176.03 | 2604% |
| 3304 | Prpns for beauty/make up for care of skn | 186.09 | 165.49 | 803% |
| 8523 | Preprd unrecorded media for sound recrdng | 143.04 | 119.85 | 517% |
| 8703 | Motr cars and othr motr vhcls | 427.41 | 142.08 | 50% |
| 1006 | Rice | 487.28 | 149.94 | 44% |
| 2710 | Petroleum oils | 7780.22 | 2077.7 | 36% |
| 8517 | Elctrcl aparts fr line telephny/telgrphy | 2704.58 | 597.98 | 28% |
| 7113 | Artcls of jewellery | 3214.21 | 419.93 | 15% |
| 7102 | Diamonds, whether or not worked, but not mounted or set | 2227.65 | 248.56 | 13% |
Source: Ministry of Commerce and Industry
Analyzing the exports to UAE at 4 digit level, the highest YoY growth of 2604% is registered by flat-rolled products of other alloy steel of width 600 mm or more from Apr 22 – March 23. It is followed by preparations for beauty makeup for skin with a YoY growth of 803% for the same time period. Moreover, prepared unrecorded media for sound recording has registered a YoY growth of 517%. Other motor vehicles registered 50% YoY growth, while rice has recorded a YoY growth of 44%.
Imports from the UAE
| Chapter | Chapter Description | Apr 22 –March 23 | Absolute Change | % Change |
| 88* | Aircraft, spacecraft, and parts thereof | 1930.37 | 1891.44 | 4859% |
| 27 | Mineral fuels, mineral oils and products of their distillation; bituminous substances; mineral waxes | 27669.39 | 7349.21 | 36% |
| 39 | Plastics and articles thereof | 1699.96 | 453.9 | 36% |
| 72 | Iron and steel | 1067.85 | 232.01 | 28% |
| 71 | Natural or cultured pearls, precious or semi-precious stones, precious metals, metals clad with precious metal and articles thereof; imitation jewellery; coin | 14789.74 | -1135.53 | -7% |
Source: Ministry of Commerce and Industry
*Including the products of MFN ‘0’.
India has seen an increase in its imports from the UAE majorly in Aircraft, spacecraft and parts thereof, which recorded a YoY growth of 4859%. Plastics and articles thereof and mineral fuels have each registered a 36% growth in imports YoY, while Iron and steel have registered a YoY growth of 28% for the same time period. On the other hand, Natural and cultured pearls and precious metals have recorded a negative growth of 7%.
Additionally, various MoUs have been signed between India and UAE during this period, showcasing enhanced spirit of cooperation, including:
- MoU between APEDA and UAE’s DP World and Al Dahra on “Food Security Corridor Initiative.”
- MoU between India and UAE on cooperation in the field of industries and advanced technologies.
- Some MoUs have also been signed on climate action and education. India will host the G-20 summit and the UAE will host COP-28 in 2023.
- MoU between India’s GIFT City (IFSCA) and Abu Dhabi Global Market (ADGM) on cooperation in financial projects and services etc.
The CEPA is also expected to encourage greater bilateral investment between India and the UAE. The agreement includes provisions for the protection and promotion of investment, which should help to provide a more secure environment for investors from both countries.
Recent regulatory changes have aimed to draw in foreign investors. The UAE offers more than 40 multidisciplinary free zones where foreign and expatriate investors can own 100% of businesses, 100% of capital and profits can be repatriated, 100% of corporate and income taxes can be avoided, and 100% of customs duties can be avoided. These areas are distinguished by effective infrastructure and services that support efficient processes.
Conclusion
The CEPA came into play with an aim to enhance various sectors including gems and jewellery, plastics, engineering goods, textiles, and agro-processed foods. Data analysis reveals that the FTA has been successful, with all sectors experiencing a steady growth rate. Furthermore, it is anticipated that these sectors will continue to expand in the future. Apart from this, there is significant potential for growth in financial, audio-visual, and entertainment services as well.
Indian manufacturers and traders have a gamut of opportunities if they can access the Emirati market. This is especially true given that the UAE serves as a financial and economic powerhouse for the region because of its generally open social environment. A local business chamber has estimated that around 11,000 new Indian companies were registered in the UAE in 2022 alone, taking the total number to 83,000. Besides being a hub for investment, UAE is also proving a vital gateway for Indian companies looking to export to other key markets in the GCC and MENA regions.


Leave a comment