
India & New Zealand: A case of untapped complementarity
Addressing India’s trade issues in the New Zealand market, particularly on preferential tariffs and regulatory standards, can help in deepening the bilateral trading relationship. In addition, technology can emerge as a major area of collaboration in sectors like dairy products.
- New Zealand’s economy has shown a quarterly growth of 14% in Q2 2021, as a result of a rise in consumer spending.
- Export of New Zealand is a larger exporter of agriculture products, with a share of 69% in total exports. Also, the country majorly imports machinery, mineral fuels, and electric equipment.
- India has a trade complementarity of 85% with New Zealand while the share of India in New Zealand’s import is only 1.2%.
- Addressing India’s trade issues in the New Zealand market can help in deepening the relationship between the two countries. Also, collaboration on technology can assist in deepening relations.

New Zealand is located in the South-western Pacific Ocean, with an area of 268.02 thousand km square. The country’s GDP in 2019 stood at US$ 206.93 billion with a population of 4.9 million. Growth of GDP between 2014 and 2018 had been more than 3%. However, in 2019, the country’s GDP growth fell to 2.81%, due to sluggish global growth and weak business conditions. Particularly, low house prices and gloomy business sentiments along with a slowdown in China and the US-China trade war contributed to this slowdown in growth.
In the current circumstances when the COVID’19 pandemic is troubling economies, New Zealand rose from its slump in Q1 2021, with quarterly growth of 14% in Q2 2021. The recovery has been on the back of fiscal and monetary stimulus introduced in the economy which in turn raised consumer spending. Trade in November 2020 showed a surplus of NZ $ 252 million. However, imports and exports have negative year-over-year growth of 17% and 0.2% respectively. Thus, trade is still below the pre-Covid levels.
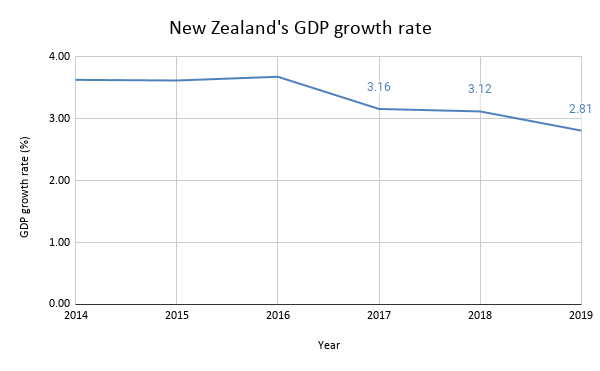
Source: World Bank, figures in % for the period 2014-2019
In the year 2019, the country exported US$ 38.18 billion worth of goods, which was around 18% of its GDP. Top export categories by share of exports were dairy products (27.9%); meat and edible meat offal (13.9%); wood and articles of wood (8.7%) and edible fruits & nuts (5.9%). In 2019, the country’s agriculture exports amounted to 69% of its total exports. Globally, New Zealand is the 22nd largest exporter of agricultural products.
Imports of New Zealand in the year 2019 stood at US$ 42.32 billion or 20.45% of its GDP, making it a net importer of goods. The major commodities that New Zealand imports are machinery (14.5%), mineral fuels (13.4%), and electric equipment (11.06%). The top trading partners of the country are China, Australia and the European Union (EU). Recently it signed on to the RCEP, which is currently the world’s largest regional free trade bloc.
Table 1: Top products imported by New Zealand
| HS Code | Product label | New Zealand’s imports in 2019 |
| 84 | Machinery, mechanical appliances, nuclear reactors, boilers; parts thereof | 6,135.44 |
| 87 | Vehicles other than railway or tramway rolling stock, and parts and accessories thereof | 5,648.41 |
| 27 | Mineral fuels, mineral oils and products of their distillation; bituminous substances; mineral | 4,678.68 |
| 85 | Electrical machinery and equipment and parts thereof; sound recorders and reproducers, television | 3,552.25 |
| 39 | Plastics and articles thereof | 1,533.17 |
| 90 | Optical, photographic, cinematographic, measuring, checking, precision, medical or surgical | 1,332.39 |
| 30 | Pharmaceutical products | 964.03 |
| 94 | Furniture; bedding, mattresses, mattress supports, cushions and similar stuffed furnishings | 876.27 |
| 73 | Articles of iron or steel | 858.10 |
| 88 | Aircraft, spacecraft, and parts thereof | 835.61 |
| 48 | Paper and paperboard; articles of paper pulp, of paper or of paperboard | 738.14 |
Source: UN Comtrade, figures in US$ million
Table 2: Top products exported by New Zealand
| HS Code | Product label | New Zealand’s exports in 2019 |
| 4 | Dairy produce; birds’ eggs; natural honey; edible products of animal origin, not elsewhere | 10,645.29 |
| 2 | Meat and edible meat offal | 5,304.40 |
| 44 | Wood and articles of wood; wood charcoal | 3,322.41 |
| 8 | Edible fruit and nuts; peel of citrus fruit or melons | 2,246.17 |
| 19 | Preparations of cereals, flour, starch or milk; pastry cooks’ products | 1,507.94 |
| 22 | Beverages, spirits and vinegar | 1,415.55 |
| 3 | Fish and crustaceans, molluscs and other aquatic invertebrates | 1,212.76 |
| 99 | Commodities not elsewhere specified | 1,192.87 |
| 84 | Machinery, mechanical appliances, nuclear reactors, boilers; parts thereof | 1,007.04 |
| 21 | Miscellaneous edible preparations | 887.21 |
Source: UN Comtrade, figures in US$ million
India’s trade with New Zealand
New Zealand’s trade with India is not significant, with the latter accounting for 1.2% share in New Zealand’s imports. In 2019, India’s exports to New Zealand amounted to US$ 383.78 million. Furthermore, India’s imports from New Zealand amounted to US$ 558.24 million in 2019, accounting for 0.1% of India’s total imports.
India’s top exports in 2019 to New Zealand were pharmaceutical products (US$ 37.2 million); other made-up textile articles (US$ 30.3 million); vehicles (US$ 23.3 million); Machinery, mechanical appliances, nuclear reactors, boilers; parts thereof (US$ 19 million)l; natural or cultured pearls, precious or semi-precious stones, precious metals (US$ 17 million) and machinery and mechanical appliances (US$ 16 million) and articles of apparel and clothing accessories, not knitted or crocheted (US$ 14.7 million). Furthermore, India’s top imports from New Zealand in 2019 were wood and its articles (US $ 196 million); mineral fuels and oils (US$ 83 million); pulp of wood or of other fibrous cellulosic material (US$ 55 million); paper and paperboard, articles of paper pulp (US$ 34.9 million); and iron & steel (US$ 33.1 million).
-
Trade complementarity
The trade complementarity index between two countries conveys the complementarity between one country’s exports with other country’s imports. A CATR research reveals that India has a high degree of complementarity with New Zealand with the complementarity index equal at 86.36%. In fact, this is the highest complementarity for India among all the non-ASEAN RCEP partners. This implies that India’s exports of intermediate, consumption, and capital goods have significant scope in the market of New Zealand.
-
Potential products
As per ITC Trade Map, India has an untapped potential of US$ 373.2 million in the Kiwi market. With a significant trade complementarity, CATR analyses the potential products that India can export to New Zealand, as given in the table below:
Table 3: Potential products that India can export to New Zealand
| Product code | Product label | India’s export to New Zealand in 2019 (value in US$ million) |
| 271019 | Medium oils and preparations, of petroleum or bituminous minerals, not containing biodiesel | 2.02 |
| 710239 | Diamonds, worked, but not mounted or set (excluding industrial diamonds) | 10.42 |
| 711319 | Articles of jewellery and parts thereof, of precious metal other than silver, whether or not | 5.39 |
| 300490 | Medicaments consisting of mixed or unmixed products for therapeutic or prophylactic purposes | 31.63 |
| 100630 | Semi-milled or wholly milled rice, whether or not polished or glazed | 7.3 |
| 30617 | Frozen shrimps and prawns, even smoked, whether in shell or not, incl. shrimps and prawns in | 5.1 |
| 870322 | Motor cars and other motor vehicles principally designed for the transport of persons | 1.59 |
| 610910 | T-shirts, singlets and other vests of cotton, knitted or crocheted | 3.11 |
| 871120 | Motorcycles, incl. mopeds, with reciprocating internal combustion piston engine of a cylinde | 0.34 |
| 870321 | Motor cars and other motor vehicles principally designed for the transport of persons | 5.59 |
Source: CATR analysis and UN Comtrade, figures in US$ million
| Issues faced by Indian exports in New Zealand |
|
|
|
As can be seen from the table above, India is at a disadvantage in some of the key products due to quality/standard norms and lack of a free trade agreement with New Zealand. Better understanding of the regulatory requirements and securing commensurate benefits for exporters through a bilateral agreement will help Indian products achieve greater market penetration.
Benefits of technology exchange
Another way to deepen the India-New Zealand relationship is collaboration on technologies. For instance, New Zealand is well known for its dairy products. The country is the leading exporter of milk and cream in 2019 with a total export of US$ 6.25 billion. Furthermore, the production of milk in 2019 in the country amounted to 1,150 thousand metric tons and whey products was recorded at 36 thousand metric tons. The dairy industry of New Zealand has evolved over the years through adopting new technologies including robotic milking, accommodating environmental concerns, efficient cow breeds, and crossbred cows. These factors have helped the industry to reduce its cost of production and increase productivity.
Indian dairy industry, on the other hand, can benefit greatly from improved storage facilities, proper education and training, and adopting more advanced processes for breeding, rearing and nutrition of the livestock. For this, Indian companies can enter into joint ventures (JVs) with their Kiwi counterparts.
One example of potential opportunities is the JV between New Zealand’s Fonterra and India’s Future consumer Ltd. Fonterra with its plan to value-added products in the market, also brings innovation, learning, and technologies to the Indian dairy sector. Such collaborations would provide scope for New Zealand’s companies to gain share in India’s large consumer market. Thus, forging ways to deepen the relations are beneficial for India and New Zealand as both countries can add significant value to each other’s economies.


Leave a comment