
India-Netherlands trade: Exploring new prospects
Netherlands becomes the third largest destination for Indian exports registering a value of US$ 14.1 billion. However, this surge is largely led by mineral fuels, and India still occupies very low shares in Netherland’s top imports. IBT analyses the key categories where India can explore a stronger push for market share gains, with a special focus on agricultural products.
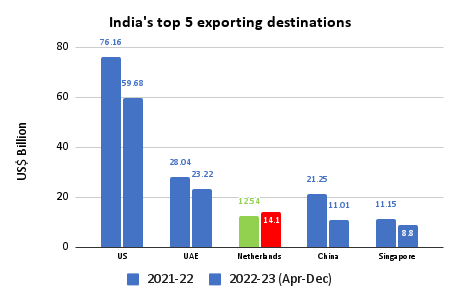
- The Netherlands has emerged as India’s third largest export destination after the US and UAE during April-December 2022-23, on account of a surge in shipments of goods such a petroleum products, electronic item, chemicals and aluminum goods.
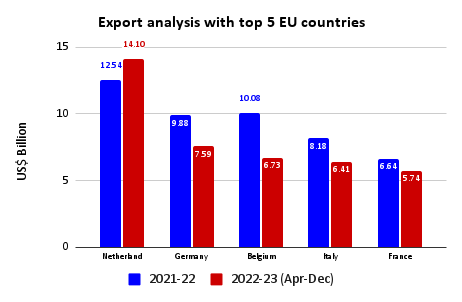
- It is currently among the top trading partners of India in Europe, after Germany, Switzerland, the UK and Belgium.
- However, the surge in exports has been led largely by mineral fuels, whereas India still has very low presence across Netherlands’ top imported categories.
- Even when it comes to agri products, India is a relatively smaller player with the exception of animal/vegetable oils and fats, where it is the largest exporter to Netherlands.
India and Netherlands share a long cherished historic bond (formally established in 1947) based on shared values, rule of law, pluralism and people to people connect. In the light of this strong convergence of both economic and political interests, both countries have continuously worked to increase collaboration and expand trade and investment.
According to recent estimates, Netherlands has emerged as India’s third largest export destinations after the US and UAE during April-December 2022-23, on account of a surge in shipments of goods such a petroleum products, electronic items, chemicals and aluminum goods. It also ranks among the top trading partners of India in Europe, after Germany, Switzerland, the UK and Belgium.
Source: Ministry of Commerce and Industry
In the process, Netherlands has taken over major destinations such as the UK, Hong Kong, Bangladesh and Germany. In 2021-22 and 2020-21, the outbound shipments to the \country stood at US$ 12.55 billion and US$ 6.5 billion, respectively. Exports are registering healthy growth continuously since 2000-01, when India’s exports to Netherlands was at US$ 880 million. Efficient port infrastructure and multi-modal connectivity with EU have cemented Netherlands’ stature as a vital gateway for trade in the region.
Source: Ministry of Commerce and Industry
India-Netherlands Trade and Commercial Relations
Netherlands has put in place plans and policies focused on connecting Dutch Businesses to development sources. The country adopted a policy framework in 2010 where private sector became the core element of Dutch development. The country since then decided to invest more in the combination of foreign trade and development creation. It has also identified its partner countries in three groups – Aid (where aid is needed to address poverty reduction); Transition (Low- and middle-income countries with burgeoning economies) and Trade (partners for trade and investment promotion that contributes to its economic growth and employment). India has been put in the third category.
Netherland is not only among the top trade partners but is the 4th largest investor in India. Cumulative FDI inflows from Netherlands to India from April 2000 to June 2022 amounted to US$ 43 billion. There are over 300 Dutch companies present in India, including Philips, Signify, Akzo Nobel, DSM, Heineken, KLM and others.
Conversely, Netherlands is also the 4th largest destination for Overseas Direct Investment (ODI) by Indian companies. More than 300 Indian companies, including all major IT companies such as TCS, HCL, Wipro, Infosys, Tech Mahindra and important players from other sectors like Sun Pharmaceuticals, Tata Steel, Solis and LT Foods, have presence in Netherlands.
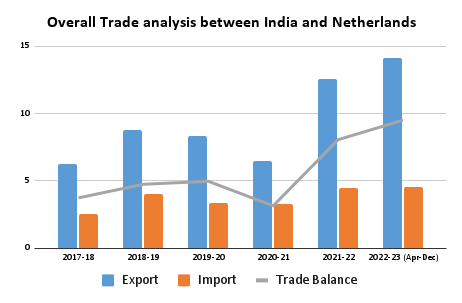
Bilateral trade breached all time high of US$ 17 billion in 2021-22. In the same period, India established a trade surplus of US$ 8.06 billion with Netherlands, which includes exports worth US$ 12.54 billion and imports worth US$ 4.47 billion.
Source: Ministry of Commerce and Industry
Netherlands’ share in India’s exports has surged to 4.19% in 2022-23 (Apr-Dec) from 2.06% in 2017-18.

Source: Ministry of Commerce and Industry
Export commodity analysis
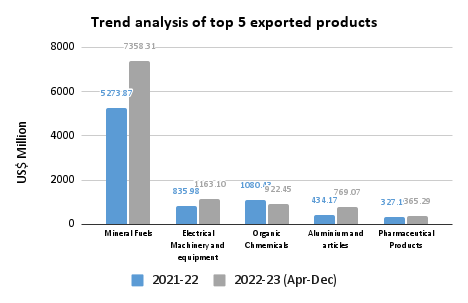
Mineral fuels (US 7.3 billion), Electrical Equipment (US$ 1.16 billion) and Organic Chemicals (US$ 922 million) have been the top exported products in 2022-23 so far, as shown in figure below. On analyzing the top 10 exported products, unwrought aluminium had the highest YoY growth of 506.09%, followed by human and animal blood for medicinal use (362.16%), telephone sets (138.51%) and Mineral fuels (excl crude) with 126.55% growth.
Source: Ministry of Commerce and Industry
Leading exports to Netherlands at the 4-digit level
| HS Code | Top 10 exported products at 4 HS level | Exported Value at 4 HS level in 2022-23 (Apr-Dec)
(US$ million) |
YoY Growth (%) |
| 2710 | Petroleum oils and oils obtained from bituminous minerals (Exl crude) | 7,354.76 | 126.55 |
| 8517 | Telephone sets: videosets | 838.94 | 138.51 |
| 7601 | Unwrought Aluminum | 728.23 | 506.09 |
| 3004 | Medicaments for therapeutic uses | 220.10 | 27.39 |
| 8504 | Electrical Transformers | 210.09 | 84.15 |
| 2933 | Heterocyclic compounds with nitrogen | 134.19 | 62.38 |
| 3002 | Human/animal blood for medicinal use | 130.99 | 362.16 |
| 1515 | Other fixed vegetable/microbial fats and oils | 125.25 | 7.06 |
| 2902 | Cyclic Hydrocarbons | 112.41 | -28.02 |
| 8701 | Tractors | 91.05 | 83.25 |
Source: Ministry of Commerce and Industry
Trade in agricultural commodities
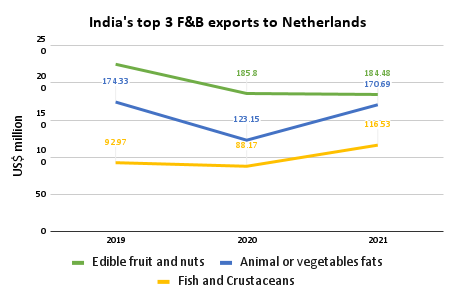
According to ITC Trade Map, India exported US$ 817.297 million worth of Food and Beverages to Netherlands. Edible fruit and nuts (US$ 184.48 million), Animal or vegetable fats and oils (US$ 170.69 million) and Fish and Crustaceans (US$ 116.53 million) were the top three exported products in 2021.
Source: ITC Trade Map
On analysing trends for the current year, India’s animal/vegetable oil exports registered a YoY growth by 11.13% to reach US$ 148.87 million in 2022 (Apr-Dec). Fish and Crustaceans, molluscs exports fell by 3.92% from US$ 95.66 million to US$ 91.91 million over the same period. Edible fruits and nuts exports saw a surge by 8.72% YoY to reach US$ 72.50 million in 2022 (Apr-Dec).
On deep diving at 4 HS Code level, Other fixed vegetable/ microbial fats and oils (HS 1515) were among the top 10 exported products during Apr-December 2022, with a value of US$ 125 million (YoY growth of 7.06%). Netherlands is India’s second highest export destination in this category after China (US$ 377.29 million). From Netherland’s point of view, India is also the largest exporter with a share of 19.1%, led by exports of Castor oil and its fractions.
Crustaceans, cooked by steaming, boiling water… (HS 0306 ) exports fell 6.19% YoY to reach US$ 84.19 million during Apr-Dec, 2022. Exports in this category are led by Vannamei shrimp, as is evident from deeper analysis. Coconuts, Brazil nuts and cashew nuts, fresh/dried… (HS 0801), also registered a fall in exports by 11.44% to reach US$ 27.06 million during the same period, where India’s major export is Cashew kernel (whole).
Areas of untapped potential
Germany, China, Belgium and US were the top exporting countries to Netherlands in 2021. India has a presence in five of Netherlands’ top imported commodities, but with very low shares. It has maximum presence in petroleum oils (excl crude) with a share of 2.2%, where Belgium, Germany and Russia are top exporters. In the case of telephone sets, exports were led by China, US and Vietnam, whereas India occupied a share of 1%.
In the field of medicaments, India had 1.3% share in Netherlands’ total imports. Top exporters in this category were Germany (27.5%), Belgium (14.7%) and Ireland (10.4%). Netherlands’ imports of medicaments by value have increased at an average annual growth rate (AAGR) of 11% between 2017-21, whereas its imports from India have grown at a much higher AAGR of 34%.
Top products exported by Netherlands (HS 4 digit level)
| HS Code | Products imported by Netherlands in 2021 | Value imported in 2021 (US$ million) | Share in world imports
(%) |
Exporting nation to Netherland | Annual growth of value
(%) |
Share of India in imports by Netherlands
(%) |
| 2709 | Petroleum oils (Inc crude) | 34,886.78 | 3.3 | Russia, US, Area n.e.s | 59 | 0 |
| 2710 | Petroleum Oils (Exc crude) | 28,007.92 | 3.9 | Belgium, Germany, Russia | 57 | 2.2 |
| 9999 | Commodities n.e.s | 25,424.44
|
4.1 | Norway, Area n.e.s, Germany | 101 | 0 |
| 8517 | Telephone Sets | 22,689.57 | 3.4 | China, US, Vietnam | 0 | 1 |
| 8471 | Automatic data processing machines | 18,239.24 | 3.8 | China, US, Taipei | 11 | 0 |
| 8542 | Electronic Integrated circuits | 15,000.70 | 1.2 | Malaysia, Costa Rica, Ireland | 10 | 0 |
| 3004 | Medicaments | 13,388.04 | 3 | Germany, Belgium, Ireland | 19 | 1.3 |
| 8703 | Motor Cars and other motor vehicles | 11,787.83 | 1.6 | Germany, Belgium, Czech Republic | 12 | 0 |
| 9018 | Instruments and appliances used in medical, surgical, dental | 11,728.17
|
7.6 | US, Ireland, Germany | 22 | 0.3 |
| 9021 | Orthopaedic appliances | 7,833.86 | 11 | US, Ireland, Switzerland | 28 | 0.1 |
Source: ITC Trade Map
In 2021, India exported a total of US$ 17.12 billion worth of Medicaments, with US, South Africa and UK being its top markets. Netherlands imported around US$ 222.7 million worth of Medicaments from India in the same year. Given India’s global prowess in this sector, and Netherlands’ growing imports over the past few years, this is definitely a potentially lucrative category.
In the case of Instruments and appliances used in medical, surgical, dental… (HS 9018), India’s global exports were recorded at US$ 1.1 billion in 2021, with US (22.7%), Germany (5.8%) and China (5.7%) being its top markets. Exports to Netherlands stood at US$ 39.84 million, accounting for 3.7% of India’s exports in this category. From Netherlands’ perspective, its total imports in this category are valued at US$ 11.73 billion, led by by US (39.7%), Ireland (15.9%) and Germany (10%). India’s exports to Netherlands in this category were recorded at US$ 33.67 million with a share of just 0.3% in Netherlands’ imports. India’s industry size for medical devices is estimated to be US$ 11 billion, out of which 60% of medical is occupied by the manufacturers making disposables and consumables. Therefore, this is another potential area where data needs to be analysed for understanding India’s export potential and ways to realise it.
Conclusion
With India and Netherlands trade touching an overall high in 2021-22, both countries still hold huge potential to boost their partnership. No doubt the sustained dialogue, technology sharing and mutual investment opportunities between the two, established bases for an ever growing partnership, supported by the increasing bilateral trade. But it is also important for the Indian government and industry to focus on the untapped potential in Netherlands for increasing exports as well as ensuring a more diversified trade basket.


We are exporter Hospital Furniture & Surgical Item/ Hospital Dresses / Hospital Equipment & Instruments
Company Name (FLASH SURGICAL INDIA PVT. LTD)