
India-Indonesia trade: Time for a strong expression of intent
India and Indonesia plan to double bilateral trade by 2025. But removal of import barriers on key products & ensuring a level playing field for Indian exporters in the Indonesian market will be key to achieve these goals.
- Indonesia ranked 16th in terms of GDP at nominal prices and 7th in terms of GDP (PPP).
- Since the setback from the Asian Financial Crisis, the counry has experienced stable growth in GDP, fluctuating at around 5%.
- India has a significant trade deficit of US$ 11 billion in bilateral trade with Indonesia, led by high imports of coal, palm oil, natural rubber and flat-rolled products of iron & steel.
- Potential export products for India to Indonesia include mineral oils and products, plastics and articles, cotton, residues, and waste from food industries, iron, and steel and machinery appliances.
Indonesia is a Southeast Asian country situated between the Indian Ocean and the Pacific Ocean. In terms of land area, Indonesia is the 15th largest country in the world and is home to a diverse set of cultures with people speaking different languages and following different religions. It is a part of many intergovernmental organisations and international forums including the United Nations, World Trade Organization, International Monetary Fund, Association of Southeast Asian Nations, East Asian Summit and G20.
As per the World Bank’s estimate, Indonesia ranked 16th in terms of GDP at nominal prices with GDP (nominal) at US$ 1.12 trillion in 2019. It’s GDP (PPP) for 2019 was valued at US$ 3.33 trillion. Also, GDP per capita for the country amounted to US$ 4,135.57 and the total population equaled 270.63 million. The unemployment rate in 2019 was at 4.69%, with an inflation rate of 3.03%. Net inflow of foreign direct investment into the country amounted to (-) US$ 20.14 billion. Furthermore, the World Bank ranked Indonesia at 73rd in terms of “Ease of Doing Business”. As per the United Nations Development Programme estimate, the country ranks 111 in Human Development Index (HDI) ranking, with HDI equal to 0.71 for the year 2019. Furthermore, the World Bank has ranked Indonesia at 73rd in terms of “Ease of doing business”. In particular, the country ranked at 116 in terms of “ease in trading across borders”, 106 in “ease of registering property” and 139 in terms of “ease in enforcing contract”.
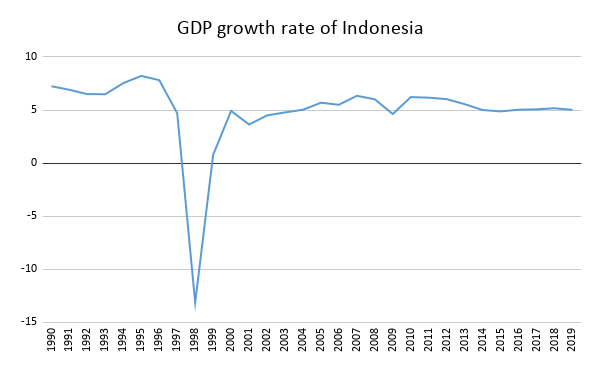
Source: World Development Indicators, figures in %
Since the Asian Financial Crisis in 1997, Indonesia has experienced a stable growth in GDP. The annual growth rate of GDP has fluctuated at around 5% between 2016 and 2019. Furthermore, World Bank reports that due to strong growth of the economy since the Asian Financial Crisis, Indonesia has also experienced a significant reduction in poverty – from 24% in 1999 to 9.7% in 2018. This growth of the economy is attributed to coordinated and sensible macroeconomic policies. The World Bank reports that growth of the economy has remained stable despite the net outflow of foreign direct investment (FDI) in 2018.
Trade performance
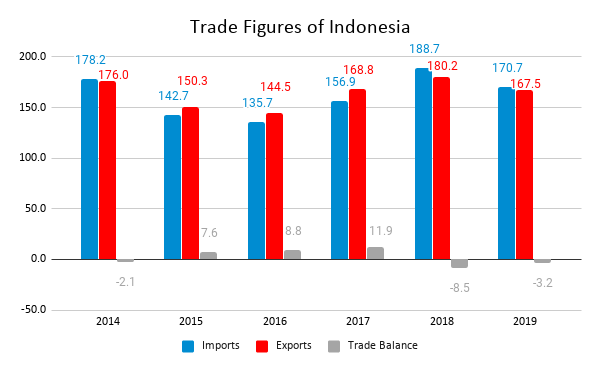
Source: ITC Trade Map, figures in US$ billion
The trade performance of Indonesia shows a deficit in recent years. The total value of exports in 2019 was recorded at US$ 167.49 billion. The country’s top exported products include mineral fuels and oils (20.73%), products of animal fats and oils (10.52%), electrical machinery and equipment (5.09%), vehicles and accessories (4.87%), and iron and steel (4.43%). Furthermore, the top export destinations for Indonesia are China, the US, Japan, Singapore, India, and Malaysia.
Total value of imports of Indonesia in 2019 amounted to US$ 170.73 billion. The top products that the country imports are machinery, mechanical appliances, nuclear reactor, and boilers with a net share of 15.69% in total imports. Other major products are mineral fuels and oils and their products (13.75%), electrical machinery and equipment (11.58%), iron and steel (6.09%), and plastics and articles (5.12%). Also, the top countries which export to Indonesia are China, Singapore, Japan, Thailand, the US and South Korea.
In the COVID-19 pandemic scenario, Indonesia is expected to see contraction in the economic growth. In particular, Indonesia’s economic growth in 2020 is projected to range between -1.7% and -0.6%. Household consumption for the 3rd quarter is expected to contract between 3% and 1.5%. This would have a significant impact, since household consumption accounts for more than 50% of the GDP in Indonesia. In August 2020, exports experienced a decline of 8.36% YoY, whereas imports dropped by 24.19%. In Indonesia, there is a slowdown in the production. Logistics and transportation are facing difficulties and distribution channels have been blocked.
India-Indonesia trade
Both Indonesia and India are among the world’s largest democracies and also share a national border (maritime) via Andaman & Nicobar Islands. In terms of Foreign Direct investment, India’s investment in Indonesia is estimated at US$ 15 billion, with investment also coming through other gateways like Singapore. According to the Investment Coordinating Board, India’s investments in Indonesia reached US$ 82.2 million in 2018, as compared to US$ 286.6 million in 2017.
Indian companies such as Wipro, SBI, Bajaj, Royal Enfield and Tata Motors have fully owned subsidiaries in Indonesia. In healthcare sector, companies such as Macleods and Nephorplus have associated with Indonesian businesses to expand operations. Inflow of investment from Indonesia to India during April 2000 to March 2020 is estimated at US$ 638 million. Bank International Indonesia (BII) has setup its branch in Mumbai with invested capital of US$ 28 million. Similarly, other companies with presence in India includ Asian Paper & pulp (APP) and CP Prima.
India has a free trade agreement with the ASEAN countries known as AIFTA. The free trade agreement was finalized in 2009 and came into force on January 1, 2010. In 2019, India’s exports to Indonesia fell by 5.98% with total exports to Indonesia equal US$ 4.52 billion. India’s imports from Indonesia also experienced a similar fall in 2019, with the total imports at US$ 15.56 billion, which is a reduction of 3.32% in comparison to imports in the previous year.
Top exports from India to Indonesia (6-digits)
| HS Code | Product Label | Indonesia’s imports from India (US$ million) | Share in India’s exports (%) |
| ‘890590 | Light-vessels, fire-floats, floating cranes and other vessels, the navigability of which is… | 571.69 | 21 |
| ‘020230 | Frozen, boneless meat of bovine animals | 301.93 | 10 |
| ‘290243 | P-Xylene | 287.70 | 11 |
| ‘120242 | Groundnuts, shelled, whether or not broken (excluding seed for sowing, roasted or otherwise… | 202.97 | 33 |
| ‘870410 | Dumpers for off-highway use | 132.49 | 37 |
| ‘870322 | Motor cars and other motor vehicles principally designed for the transport of persons, incl… | 87.75 | 3 |
| ‘890110 | Cruise ships, excursion boats and similar vessels principally designed for the transport of… | 78.66 | 13 |
| ‘271012 | Light oils and preparations, of petroleum or bituminous minerals which >= 90% by volume “incl… | 76.63 | 1 |
| ‘840290 | Parts of vapour generating boilers and superheated water boilers, n.e.s. | 70.93 | 49 |
| ‘271019 | Medium oils and preparations, of petroleum or bituminous minerals, not containing biodiesel… | 65.25 | 0 |
Top imports by India from Indonesia (6-digits)
| HS Code | Product label | India’s imports from Indonesia (US$ million) | Share in India’s total imports (%) |
| ‘270119 | Coal, whether or not pulverised, non-agglomerated (excluding anthracite and bituminous coal) | 6,322.863 | 31 |
| ‘151110 | Crude palm oil | 2,352.957 | 66 |
| ‘890590 | Light-vessels, fire-floats, floating cranes and other vessels, the navigability of which is… | 943.007 | 42 |
| ‘270112 | Bituminous coal, whether or not pulverised, non-agglomerated | 626.718 | 29 |
| ‘151190 | Palm oil and its fractions, whether or not refined (excluding chemically modified and crude) | 276.721 | 15 |
| ‘400122 | Technically specified natural rubber “TSNR” | 246.863 | 41 |
| ‘721913 | Flat-rolled products of stainless steel, of a width of >= 600 mm, not further worked than hot-rolled… | 212.418 | 82 |
| ‘382319 | Fatty acids, industrial, monocarboxylic; acid oils from refining (excluding stearic acid, oleic… | 206.096 | 61 |
| ‘720260 | Ferro-nickel | 187.729 | 49 |
| ‘281820 | Aluminium oxide (excluding artificial corundum) | 173.162 | 18 |
Source: ITC Trade Map
As the tables indicate, the top exported product by India to Indonesia in 2019 was light-vessels, fire-floats, floating cranes and other vessels… followed by frozen boneless meat, P-Xylene and groundnuts. The major products that are imported by India from Indonesia include mineral fuels, chemical products, metal, iron and steel, palm oil, and floating structures. The top product imported by India from Indonesia in 2019 was coal with a share of 31.43% in India’s total imports of this product.
India is also the world’s largest importer of palm oil from Indonesia. In August 2020, the import of palm oil in India has seen a decline as a result of restriction on the imports of RBD palmolein. This would likely have a significant impact on India’s total imports from Indonesia. Furthermore, India has decided to not join the RCEP. This decision might also have an impact on the tariff relaxations on imports of products like beef from India and palm oil from Indonesia.
In 2018, on an official visit to Indonesia, Prime Minister of India Narendra Modi consulted with the President of Indonesia Mr. Joko Widodo regarding areas with the potential to deepen the bilateral relationship. Governments of both nations are looking to more than double bilateral trade by 2025. Indonesia has agreed to increase its imports of auto parts, sugar and buffalo meat. Based on an analysis of current market share, other potential products in which India can increase its exports to Indonesia are mineral oils and products, plastics and articles, cotton, residues, and waste from food industries, iron, and steel and machinery appliances. Similarly, Indonesia can explore trade expansion in organic chemicals, mineral fuels and oils
Furthermore, there are possibilities to increase trade by reducing non-tariff barriers. As Piyush Goyal, Minister of Commerce and Industry suggested, the auto industry’s products of India face quota restrictions. Also, it takes a significantly long time to register for the new vehicles. The same is true for buffalo meat, which has great potential in the Indonesian market, also faces import restrictions.
During the 17th ASEAN-India Economic Ministers Consultations on August 29, trade ministers of both sides have agreed to initiate discussions to review the scope of the AIFTA. India has raised two key points of concern – that the agreement has denied its exporters a level playing field in the ASEAN region; and secondly, China has taken unfair advantage of the AIFTA due to weak rules of origin. An instance of this is Indonesia itself, which has lowered customs duties on just 50% of India’s exports, while India has lowered duties on 75% of Indonesian products. Addressing these imbalances in the FTA will be key to drive the relationship forward as per the stated goals of both regions.


Ηi, I think your blog might be haνing browser compatibility issues.
When I look at ʏour blog site in Safari, it looks fіne but when opening in Internet Exрlorer, it has some overlappіng.
I just wanted to give you a quick heads up! Other then that,
amazing blog!