
Country Profile – Egypt

Photo by Spencer Davis from Pexels
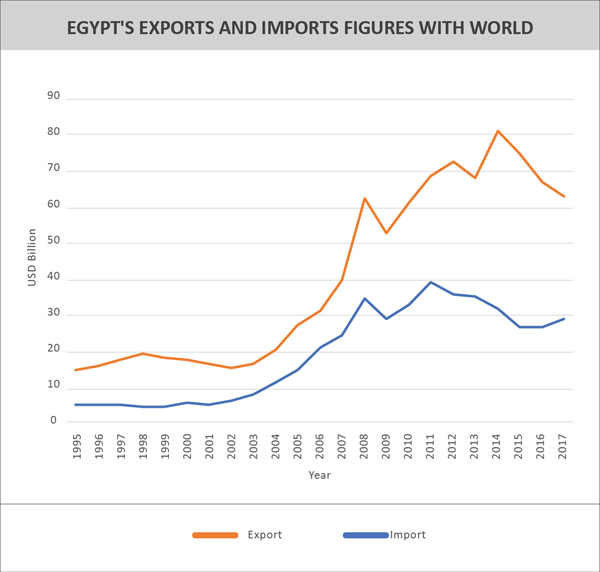
Egypt is the 62nd largest export economy in the world and the 72nd most complex economy according to the Economic Complexity Index (ECI). In 2017, Egypt exported $30.1B and imported $64.1B, resulting in a negative trade balance of $34B. In 2017 the GDP of Egypt was $235B and its GDP per capita was $11.6k.
Occupying the northeast corner of the African continent, Egypt is bisected by the highly fertile Nile valley where most economic activity takes place. Egypt’s economy was highly centralized during the rule of former President Gamal Abdel NASSER but opened up considerably under former Presidents Anwar EL-SADAT and Mohamed Hosni MUBARAK. Agriculture, hydrocarbons, manufacturing, tourism, and other service sectors drove the country’s relatively diverse economic activity.
Despite Egypt’s mixed record for attracting foreign investment over the past two decades, poor living conditions and limited job opportunities have contributed to public discontent. These socioeconomic pressures were a major factor leading to the January 2011 revolution that ousted MUBARAK. The uncertain political, security, and policy environment since 2011 has restricted economic growth and failed to alleviate persistent unemployment, especially among the young.
In late 2016, persistent dollar shortages and waning aid from its Gulf allies led Cairo to turn to the IMF for a 3-year, $12 billion loan program. To secure the deal, Cairo floated its currency, introduced new taxes, and cut energy subsidies – all of which pushed inflation above 30% for most of 2017, a high that had not been seen in a generation. Since the currency float, foreign investment in Egypt’s high interest treasury bills has risen exponentially, boosting both dollar availability and central bank reserves. Cairo will need to make a sustained effort to implement a range of business reforms, however, to induce foreign and local investment in manufacturing and other labor-intensive sectors.
Egypt’s top exported and imported Agri Products
| Top exported products (Million US$) | Value | HS CODE | Top imported products (Million US$) | Value | |
| HS0805 | Citrus fruit, fresh or dried | 634 | HS1001 | Wheat and meslin | 2 624 |
| HS0406 | Cheese and curd | 273 | HS1005 | Maize (corn) | 1 723 |
| HS0701 | Potatoes, fresh or chilled | 273 | HS0202 | Meat of bovine animals, frozen | 1 029 |
| HS1701 | Cane or beet sugar | 235 | HS1201 | Soya beans, whether or not broken | 864 |
| HS0703 | Onions, shallots, garlic, leeks | 234 | HS1701 | Cane or beet sugar | 800 |
Egypt’s top exported and imported Non-Agricultural Products
| Top exported products (Million US$) | Value | HS CODE | Top imported products (Million US$) | Value | |
| HS2710 | Petroleum oils, other than crude | 2 440 | HS2710 | Petroleum oils, other than crude | 5 577 |
| HS7108 | Gold | 2 107 | HS2711 | Petroleum gases | 3 513 |
| HS2709 | Petroleum oils, crude | 2 106 | HS3004 | Medicaments in measured doses | 1 961 |
| HS3102 | Nitrogenous fertilisers | 974 | HS2709 | Petroleum oils, crude | 1 751 |
| HS8544 | Insulated electric conductors | 766 | HS8703 | Motor cars for transport of persons | 1 683 |
India-Egypt Trade and Commercial Relations:
India’s top 10 exports to Egypt
| HS CODE | Product Labels | India’s exported value to Egypt in USD Million in 2017 | Equivalent ad valorem tariff faced by India in % |
| TOTAL | All products | 2349.534 | |
| 020230 | Frozen, boneless bovine meat | 265.895 | 0 |
| 271019 | Medium oils and preparations | 194.869 | 5 |
| 390760 | Polyethylene terephthalate”, in primary forms | 91.213 | 0 |
| 870321 | Motor cars | 73.761 | 27 |
| 281820 | Aluminium oxide (excluding artificial corundum) | 62.546 | 2 |
| 520523 | Single cotton yarn | 60.926 | 5 |
| 520524 | Single cotton yarn with different densities | 37.408 | 5 |
| 100630 | Semi-milled or wholly milled rice | 35.784 | 0 |
| 540233 | Textured filament yarn of polyester (excluding that put up for retail sale) | 25.541 | 5 |
| 294200 | Separate chemically defined organic compounds | 25.471 | 2 |
India’s top 10 imports from Egypt
| HS CODE | Product Labels | India’s imported value from Egypt in USD Million in 2017 | Equivalent ad valorem tariff faced by India in % |
| TOTAL | All products | 1216.074 | |
| 2709 | Petroleum oils, crude | 701586 | 0 |
| 2510 | Natural calcium | 121.002 | 5 |
| 2711 | Petroleum gas and other gaseous hydrocarbons | 115.837 | 4 |
| 5201 | Cotton, neither carded nor combed | 45.640 | 0 |
| 2704 | Coke and semi-coke of coal | 34.010 | 5 |
| 7005 | Float glass and surface ground or polished glass | 21.530 | 10 |
| 805 | Citrus fruit, fresh or dried | 17.430 | 30 |
| 1209 | Seeds, fruits and spores | 16.685 | 9 |
| 7019 | Glass fibres, incl. glass wool | 12.172 | 10 |
| 2707 | Oils and other products of the distillation of high temperature coal tar | 8.391 | 3 |
Commercial Presence Out of the 50 Indian companies operating in Egypt with a combined investment of roughly US $ 2.5 billion, approximately 25 companies are joint ventures and wholly owned Indian subsidiaries. The rest of the Indian companies operate in Egypt through their representative offices and execute various projects for Governmental organizations. Major Indian investments in Egypt include TCI Sanmar, Alexandria Carbon Black, the Alexandria Fibre Co., Dabur India’s production facility for its cosmetics line, Egypt-India Polyester Company (EIPET) for manufacture of PET Resin, SCIB Paints, etc. The Oberoi Group manages a hotel and runs Nile cruises; Kirloskar Brothers sells diesel engines and irrigation pump sets in Egypt; Ashok Leyland, Tata Motors, Maruti Suzuki and Mahindra & Mahindra market their vehicles in Egypt, and Bajaj Auto dominates the three-wheelers market. Indian Public Sector Undertakings like Gas Authority of India Ltd, ONGC Videsh Ltd (OVL)., Gujarat State Petroleum Corporation (GSPC) also have a presence in Egypt, as does the State Bank of India. Indian companies also execute projects in railway signaling, pollution control including air pollution equipment, water treatment, irrigation, anti-collision devices etc.


Leave a comment